Patterns in birthdays

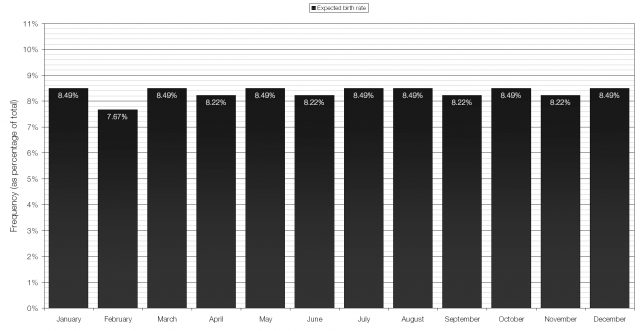
If births were evenly distributed throughout the year (i.e. a 1 in 365 chance of being born on any given day) then the graph of number of births against birth month would look like the one below:

You’re least likely to be born in February, because it only has 28 days, and then slightly more likely to be born in the 31-day months of January, March, May, July, August, October and December than in the 30-day months of April, June, September and November.

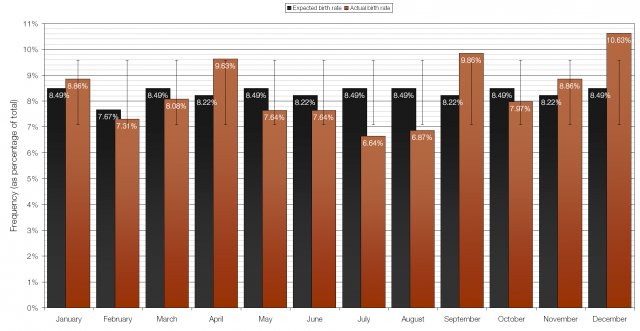
I took the data from nearly a thousand pupils and looked at how their dates of birth compared with the expected values. (Included with the data are error bars of one standard deviation.)

The results for April, September and December (particularly December) show birth rates above what would be expected if births are random, and the results for July and August show depressed birth rates.

Considering the months where births are more likely than they should be and working backwards we find the most likely “sex months” to be March, July and December. These seem fairly sensible as all of these months coincide with major holiday periods: Easter, the long Summer Holiday and Christmas/New Year. People are more likely to be “celebrating” and to have more free time during these periods, and March and December have long, cold and dark nights when people are more likely to stay indoors in the evening than go out.

The “sex months” for the lowest birth rates are more puzzling: October and November. I suspect that it has to do with Seasonal Affective Disorder (SAD) and that the generalised depression that comes with SAD includes reduced sex drive; this is combated come December by the general presence of good cheer and plenty of alcohol to lower inhibitions. It is also possible that parents are deliberately choosing when to conceive in order to avoid their child being the youngest in the school year, something that has been shown* to have a negative effect.

Update: Thanks to @S3ym5n I’ve now included national data for 2010.
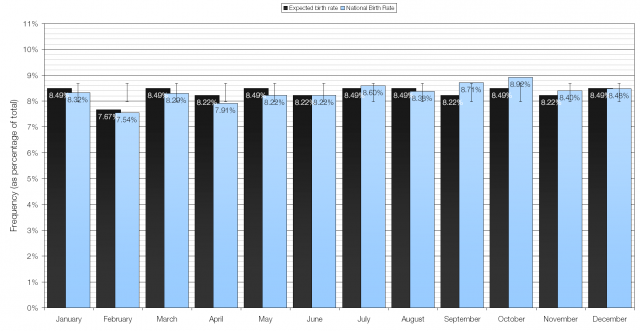
In the national data it is September and October that show birth rates above what is expected, making December and January the most popular sex months. April appears to be the only month with a significantly lower birth rate, making July, when people are out and about in the nice weather rather than stuck indoors, the least popular sex month.
Continue reading

Curiosity’s nuclear battery

The Curiosity rover that is the main part of the Mars Science Laboratory mission is very different from its predecessors Sojourner and the twin rovers Spirit & Opportunity.

L-R: Spirit/Opportunity, Sojourner and Curiosity.

L-R: The wheels of Sojourner, Spirit/Opportunity and Curiosity.

Curiosity is nearly twice as long as Spirit/Opportunity and has more than five times the mass; at 2.1 metres in height it is taller than most of the people that built it.

For me, the most interesting difference between Curiosity and the other Mars rovers is its power source. Both Sojourner and Spirit/Opportunity were powered by solar cells but Curiosity is powered by a radioisotope thermoelectric generator (RTG), in particular the Multi-Mission Radioisotope Thermoelectric Generator (MMRTG) built by Pratt & Whitney’s Rocketdyne division.

Curiosity‘s RTG is the large unit attached to the rover’s rear.

The main problem with using solar cells for power is that the cells only work during daylight hours and don’t function well at high latitudes where there is less sunlight; Spirit/Opportunity‘s cells only worked at full strength for about four hours per day, producing about 900 watt hours (about 3.2 megajoules) per day at best. Mars is covered in fine dust and dust covering solar panels was a problem for the Spirit and Opportunity rovers, though this dust was occasionally blown away by high winds.

Spirit‘s solar panels before and after a “cleaning event”.

RTGs work via the Seebeck effect, where a difference in temperature between between the two junctions of a thermocouple cause an electric current to be produced. The heat source in an RTG is the decay of a radioactive isotope; in the case of most RTGs this isotope is plutonium-238 in the form of plutonium dioxide. Pu-238 is a nearly pure alpha emitter and therefore requires only minimal shielding.

A pellet of 238PuO2 glows red hot from internal radioactive decay.

The MMRTG uses 32 marshmallow-sized plutonium pellets and will initially produce about 125 watts of electrical power (from 2000 watts of thermal power), but this will drop off over time as the plutonium decays. The MMRTG will consistently produce about 2500 watt hours of electricity per day compared with Spirit/Opportunity‘s average of 600 Wh and this will enable Curiosity to operate in all seasons and at all times of day.

Curiosity’s MMRTG before installation.

You’ve already experienced the earliest Easter you’ll ever know

You may have noticed that the date of Easter Sunday changes every year:

The date of Easter Sunday is calculated using a calendar that is based both on the Sun and the Moon* and takes place “on the first Sunday after the Paschal Full Moon”. Because the Gregorian calendar is based on the Sun only, the date of Easter changes from year to year.

The Paschal Full Moon is based not on an actual astronomical event but on historical tables established by a bunch of religious guys in 325AD, and its date can be up to ± 2 days from the actual astronomical Full Moon. The Paschal Full Moon is selected as the first of the Full Moons recorded in these tables to follow the March Equinox (also known as the vernal equinox as it is the day on which the night and day are the same length when heading into Spring in the northern hemisphere and coming from the Latin ver for spring).

When a line connecting adjacent dates is drawn a pattern becomes obvious, especially when the scale is compressed.

The earliest Easter can possibly fall is March 22nd, though this is very rare, occurring most recently in 1818 and next in 2285. The next earliest date is March 23rd, as it was in 2008 and this will not happen again until 2160, by which time you will be dead.

The latest date Easter can occur is April 25th, which last occurred in 1943 and will next occur in 2038. The cycle for Easter dates repeats every 5 700 000 years exactly, and the most common date within that cycle is April 19th, occurring in 3.9% of cases. Easter moving around to the extent explained above is a real pain and in my opinion we should all just agree that from now on Easter Sunday is always the nearest Sunday to April 19th.

* Lunisolar calendars like this are used by many Jews, Buddhists, and some Hindus as well as those in Burma, China, Korea, Mongolia, Tibet and Vietnam.

Logarithmic scales

Some of the quantities measured in physics cover a very large range of values and this can make displaying measurements of their value difficult or confusing.

pH, traditionally thought of as a measurement of acidity, but actually a measurement of the concentration of hydrogen ions,* is one such quantity. Stomach acid has a concentration of hydrogen ions of 0.1 per mole; bleach has a concentration of hydrogen ions of 0.0000000000001 per mole.

In order to have a sensible scale by which to judge acidity a logarithmic scale is used: pH is the negative of the logarithm of the concentration of hydrogen ions, so for stomach acid pH = −log(0.1) = 1.0 and for bleach pH = −log(0.0000000000001) = 13.

As can be seen from the graph above, it becomes very difficult to tell the difference between H+ concentration beyond pH 2 or 3. But on a logarithmic scale the difference is clearly visible:

There has been some fuss on various blogs about a chart from the Minnesota Dental Association (58kB, .PDF) listing the acidity of various sweets. One sweet, WarHeads Sour Spray is listed as having a pH of 1.6, which when compared with battery acid at pH 1.0 sounds very alarming. But when the logarithmic scale is taken into account an increase of 0.6 on the pH scale is equivalent to a four-fold decrease in acidity – Sour Spray is only one-quarter as acidic as battery acid (that’s still pretty acidic, by the way, and not terribly good for your teeth).

The moment magnitude scale used to measure the strength of earthquakes is another logarithmic scale. Earthquakes vary in size (i.e. in the energy they release) from the giant MW 9.5 earthquake in Chile in 1960 to tiny tremors caused by large vehicles going past and so a logarithmic scale is required. Because of the way that the moment magnitude scale is calculated an increase in moment magnitude of 1.0 indicates a 31.6-fold (101.5) increase in the amount of energy released (an increase in moment magnitude of two is equivalent to a 1000-fold (103) increase).

* For the sake of simplicity I’m ignoring the effect of the activity factor, the tendency of hydrogen ions to interact, on pH.

The Milky Way is shaped like a CD

The Earth orbits just one of the 200-400 billion stars that make up the Milky Way. This star, the Sun, orbits at a distance of about 27000 light years from the Galactic Centre, travelling at 220 km/s (one mile every seven thousandths of a second).

The Milky Way is about 100000 light years across, but only about 1000 light years in height, making it about one hundred times wider than it is tall. To scale, viewed from side on, it would look like the line below:

With a thickness of 1.2 millimetres and a diameter of 120 millimetres a standard CD or DVD has exactly the same thickness:width ratio as the Milky Way; you could correctly describe our galaxy as “CD-shaped”.

Update: I’m reliably informed that a thickness of 1000 light years is incorrect, and that the true thickness is probably somewhere around 2000-3000 light years, and could be as large as 6000 ly. (It also depends very heavily on your definition of the “edge” of the Universe.)