Tag Archives: infrared

Hacking PIN pads using thermal vision

There is a mission in the first Splinter Cell computer game where you have to use your thermal vision to read a keypad code entered by a guard. Researchers from University of California San Diego have now shown that this is entirely possible.

Building on earlier work by Mike Zalewski the researchers have shown that codes can be easily discerned from quite a distance (at least seven metres away) and image-analysis software can automatically find the correct code in more than half of cases even one minute after the code has been entered. This figure rose to more than eighty percent if the thermal camera was used immediately after the code was entered.

K. Mowery, S. Meiklejohn, and S. Savage. 2011. “Heat of the Moment: Characterizing the Efficacy of Thermal-Camera Based Attacks”. Proceedings of WOOT 2011. (.PDF 9.53Mb).

Infrared imagery of the transport of nuclear waste

As much as I loathe Greenpeace, they’ve released some fantastic infrared imagery of nuclear waste being transported by train. The intent seems to be to try and get people to think that the casks are emitting something dangerous, but I think they do quite the opposite.

The waste is being transported in CASTOR containers from Germany to France for reprocessing and then back to Germany for reuse.

I haven’t been able to find much information from Greenpeace about the images, but I love how they’re described by National Geographic (who should know better) as Red-Hot Nuclear-Waste Train Glows in Infrared despite the fact that they’re not even close to red hot: at somewhere around 35°C they’re actually colder than the people watching them.

Images copyright Greenpeace

Snow-covered UK seen from space

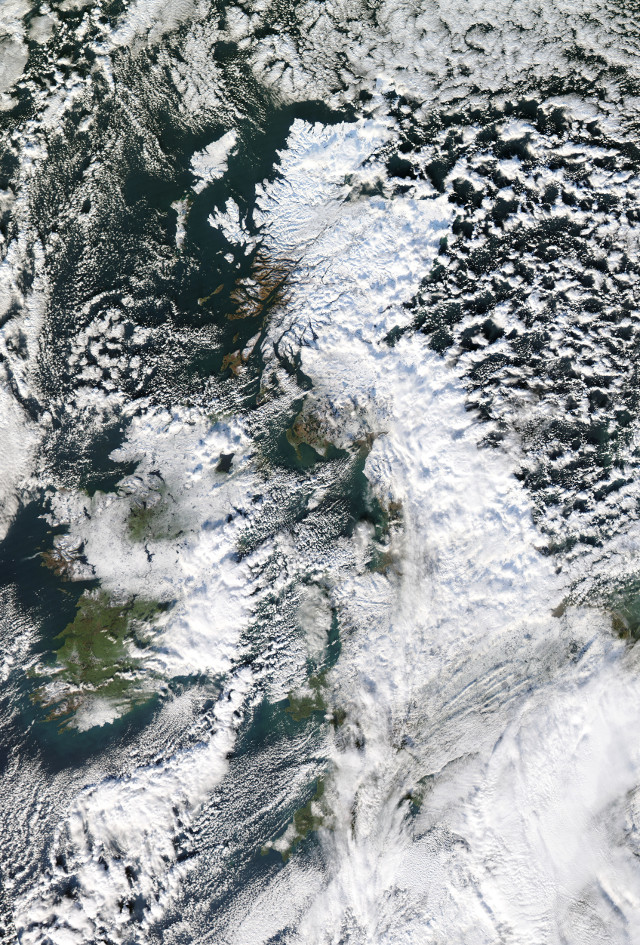
In January I posted an image from NASA’s MODIS satellite showing the UK covered in snow. I’m doing the same for the recent snow; these images were taken today (1st December) between 1110 and 1430.

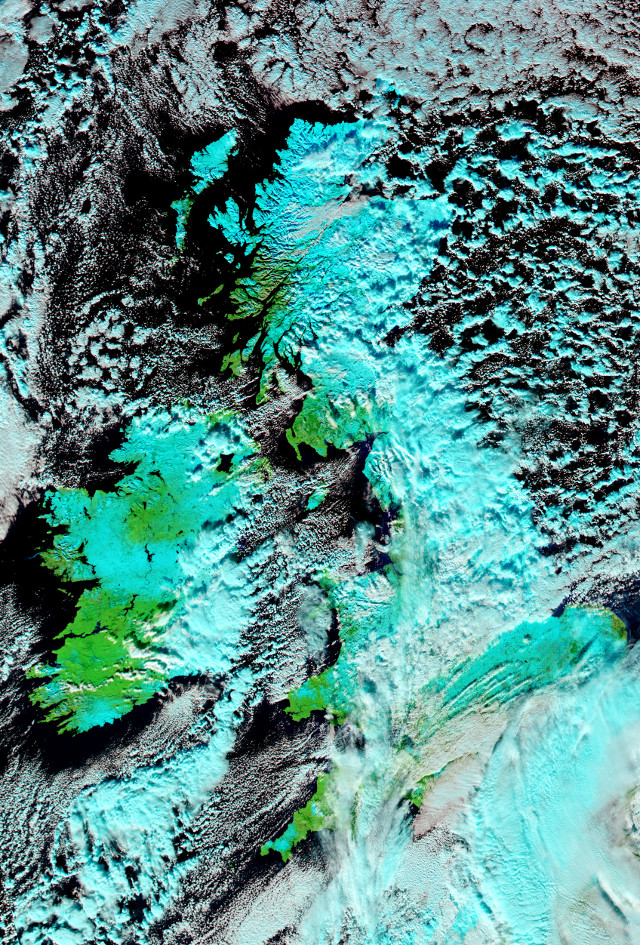
The problem with this image is that snow and clouds are both white so it’s difficult to tell the difference between the two. Luckily NASA also provides some false colour imagery at long wavelengths (670 nanometres, 876nm and 2155nm) that makes this job easier.

Ice is very absorbent in the 2155nm band (shortwave infrared) that is assigned to the red channel of the image, but reflects in the visible red (670nm) and near infrared (876nm) bands that are assigned to the green and blue channels respectively, causing ice to appear cyan. Vegetation is absorbent in both the near and shortwave infrared which leaves it looking green.

Higher resolution imagery is available from the NASA MODIS Rapid Response System.

Infrared thermometers and swine flu

One of the symptoms of Influenza A H1N1, also known (incorrectly) as “swine flu” is a fever – increased body temperature. It’s difficult and very time consuming to measure the temperature of every passenger arriving at an airport using conventional mercury-in-glass (or alcohol-in-glass) thermometers but luckily physics has a solution.

Every object with a temperature above absolute zero emits electromagnetic radiation. At around body temperatures this radiation is mainly in the infrared part of the spectrum. By measuring the infrared radiation that a person emits it’s possible to tell how hot that person is.

The Boston Globe’s Big Picture has a series of photographs from the H1N1 outbreak, including two photographs of infrared temperature monitoring in use. In the first photograph you can see technicians in protective suits carrying infrared thermometers; the four dots seen on the patient’s head are used to indicate the area being sampled.

infrared-thermometer-swine-flu

In this second photograph you can see an infrared thermogram in the background whilst a patient’s mouth is examined.

infrared-thermometer-swine-flu2