Tag Archives: weather

Humidex

Human beings judge how warm they are by how quickly heat leaves the body (we have specialised cells called thermoreceptors that do this job), and maintain temperature by controlling sweating. As sweat evaporates from the skin, it takes heat away from the body and therefore the rate of evaporation affects the rate of heat loss.

When the air is very humid, it is more difficult for evaporation to take place, and therefore humidity affects people’s perception of the temperature: when the air is very humid it feels warmer than it really is. Humidex is an index used by Canadian meteorologists to calculate this apparent temperature.

The dew point is the temperature at which water condenses out of the air and is linked to the relative humidity. If the relative humidity is 100% then the dew point is equal to the current temperature; when the current temperature is below the dew point then water will leave the air (the dew point cannot be higher than the current temperature).

humidex

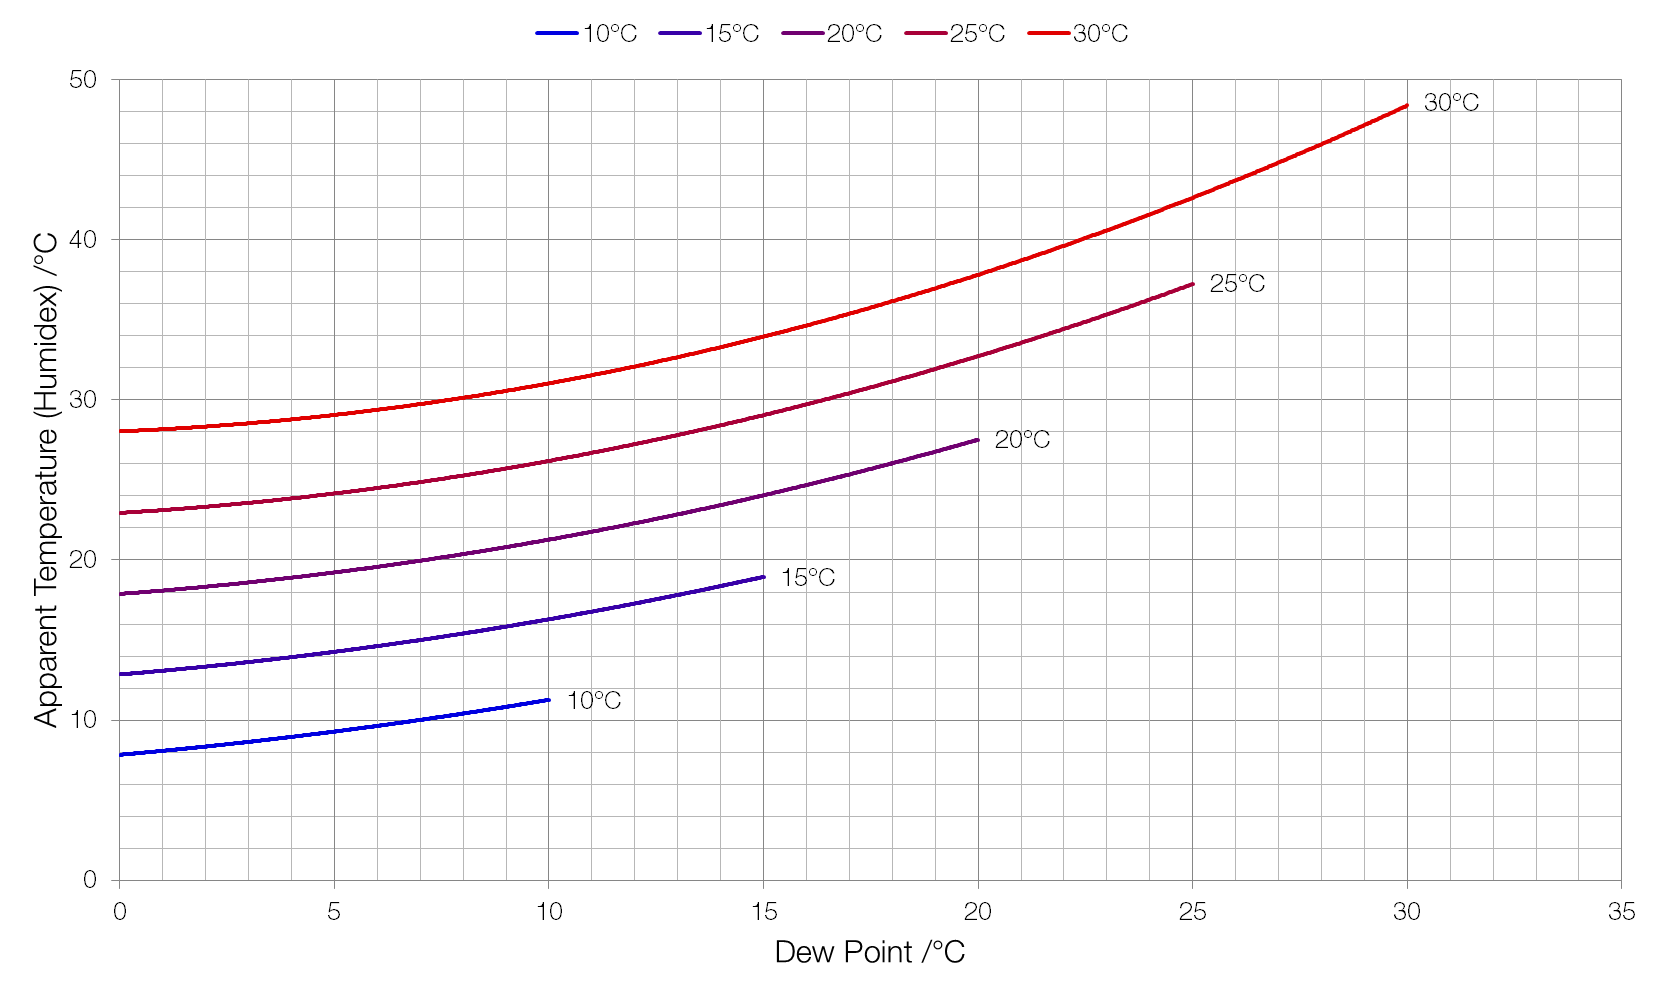
As you can see, as the dew point increases the perceived temperature increases. When the air temperature is 20ºC and the dew point is also 20ºC  then the perceived temperature will be 27.6ºC.

The hottest and most humid parts of the world are the coastal areas around the Arabian Peninsula. On July 8th 2003 in Dharan, Saudi Arabia the air temperature was 42.2ºC with a dew point of 35ºC; this yields a humidex of an almost-unbearable 68.9ºC. If we combined the hottest recorded temperature of 56.7ºC in Death Valley, California with this Saudi Arabian dew point record that would yield a humidex of 83.4ºC, which would have killed people: luckily the Death Valley area is a desert valley and the dew point is usually quite low.

The Beaufort Scale

Many of you will be familiar with the Beaufort Scale, used to measure wind speed. (Although it’s full name is the Beaufort Wind Force Scale, it does not measure force in the physical sense.) Although the scale is usually taken to relate to open ocean conditions (e.g. Force 6 has been referred to as “Strong Breeze – Long waves begin to form. White foam crests are very frequent. Some airborne spray is present.”) there is an empirical relationship between Beaufort Scale and wind speed:

v = 0.836 B^{3/2}

Where v is windspeed and B is the 1946 Beaufort Scale.

beaufort

The Beaufort Scale only officially goes up to Force 12 (“Hurricane Force – Huge waves. Sea is completely white with foam and spray. Air is filled with driving spray, greatly reducing visibility.”) but it could be (and has been) applied to hurricanes (normally measured on the Saffir-Simpson Scale), or tornadoes (normally measured on the Enhanced Fujita Scale). Hurricane Felix, a Category 5 hurricane that struck Nicaragua and Honduras in 2007 had a peak wind speed of 175 mph, equivalent to a Beaufort Scale of 20.7; and the 318 mph wind speed measured by Doppler radar during the Moore Tornado of 1999 would be equivalent to a Beaufort Scale of 30.7.

Solar wind and real wind

“Solar wind” is a colloquial term for the stream of charged particles ejected from the surface of the Sun by heat and strong magnetic fields. It is the interaction between the solar wind and Earth’s magnetic field that is responsible for the aurorae.

During solar storms, when larger amounts of material are ejected at higher speeds (a coronal mass ejection) the solar wind can cause damage to satellites and even to power grids on Earth.

But a new paper from South Korean scientists suggests that the solar wind affects the real wind; that the solar wind hitting the atmosphere can affect the pressure at sea level. Their suggestion is that changes in clouds are caused by currents flowing from the ionosphere (a charged upper layer of the atmosphere) to the land/ocean; and that the solar wind affects these currents. They measured a increase in pressure of about 2500 pascals (over a standard pressure of 101325 pascals) in the days following solar winds above 800km/s.

Il-Hyun Cho et al. 2011. “Changes in Sea-Level Pressure over South Korea Associated with High-Speed Solar Wind Events.” arXiv: 1107.1841v1 [astro-ph.EP]

Snow in the Atacama Desert

A convincing argument can be made that the Atacama Desert in Chile and Argentina is the driest place on Earth. The average rainfall is one millimetre per year and some weather monitoring stations have never detected rain. This week eighty centimetres of snow fell in the region.

This is what the desert normally looks like:

And this is how it looks now:

The South Pacific is on the left of the image and Chile and Argentina on the right.

It’s difficult to differentiate between cloud and snow in the true-colour image above, but the false-colour image below makes the difference more obvious.

Areas covered in snow are bright white in the visible part of the spectrum and all the visible light detected by the camera in the second image is mapped to the red channel of the image. Ice is very absorbent in the shortwave infrared region that is mapped to the green and blue channels and therefore ice appears bright red.

Snow-covered UK seen from space

In January I posted an image from NASA’s MODIS satellite showing the UK covered in snow. I’m doing the same for the recent snow; these images were taken today (1st December) between 1110 and 1430.

The problem with this image is that snow and clouds are both white so it’s difficult to tell the difference between the two. Luckily NASA also provides some false colour imagery at long wavelengths (670 nanometres, 876nm and 2155nm) that makes this job easier.

Ice is very absorbent in the 2155nm band (shortwave infrared) that is assigned to the red channel of the image, but reflects in the visible red (670nm) and near infrared (876nm) bands that are assigned to the green and blue channels respectively, causing ice to appear cyan. Vegetation is absorbent in both the near and shortwave infrared which leaves it looking green.

Higher resolution imagery is available from the NASA MODIS Rapid Response System.