Everybody knows that water freezes at 0°C and melts at 100°C, right?
Except that’s not always true. The melting point and boiling point of water depends on the pressure of the water: water only freezes at 0°C and melts at 100°C when it’s at standard atmospheric pressure: 101325 pascals. For example, you cannot make a good cup of tea at the peak of Mount Everest because the pressure is lower there and therefore water boils at a lower temperature (around 71°C), lower than the temperature required to properly release the flavour from the tea.
Information about a substance’s melting and boiling points at different pressures can be represented on a phase diagram. The phase diagram for water is shown below:
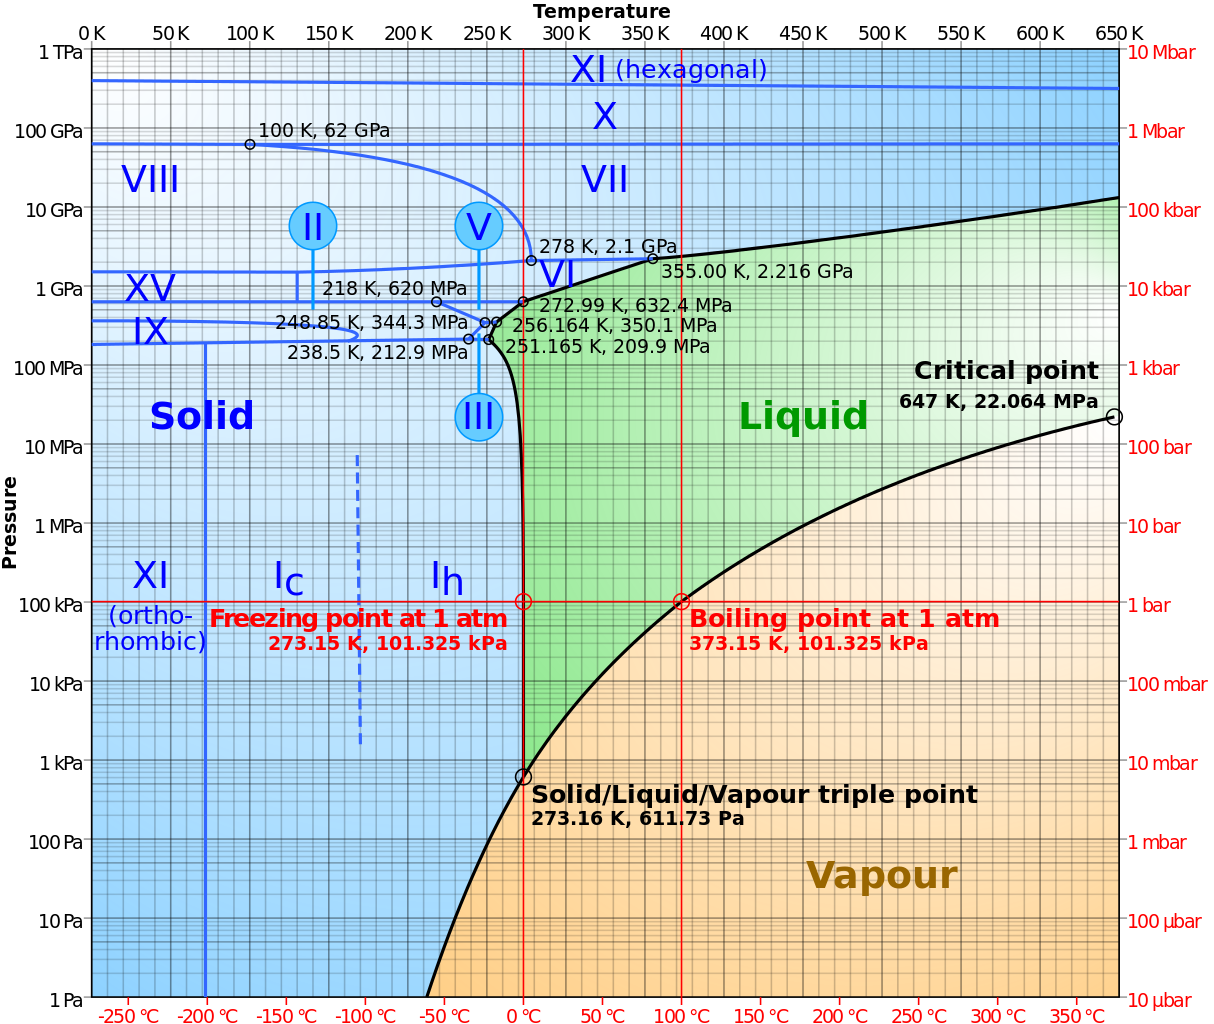
From the diagram, we can see that at pressures below around 600 Pa, water transforms from a solid to a gas without passing through a liquid phase. This is a process known as sublimation, and is most well-known from the carbon dioxide “fog” created when dry ice is placed into hot water. We can also see the triple point, a combination of temperature and pressure (0.01°C and 611.73 Pa) at which ice can exist in all three states simultaneously.
Cyclohexane at its triple point boiling and freezing simultaneously.
At higher pressures, the melting point of water changes. Water can remain as solid ice up to temperatures of more than 300°C when the pressure is above ten gigapascals. What is also interesting is the different types of solid water that are formed at different pressures and temperatures.
Hi. Great piece. (and after a bit of a gap ? ) It’s not clear when it says Water… melts at 100 °C’ at a couple of points. Thx! Nary
I think he means boils.
I’m still trying to wrap my head around seeing the water vaporizing inside a mason jar of soup as it cools after high-pressure canning. The bubbles being generated are so much bigger than the headspace in the jar, and yet the lid stays tight onto the jar.