Monthly Archives: June 2011

FAST

The effectiveness of a telescope depends on its size; a larger telescope can gather more signals than a smaller one and therefore provide more information about the object being observed.

Since 1963 the 305-metre Arecibo Observatory has been the world’s largest and (therefore) most sensitive full-dish radio telescope.

But in March of this year China began construction of FAST, the Five Hundred Metre Aperture Spherical Telescope, in a natural depression in southwest China.

Costing $100m and due to be completed by the end of 2013, FAST will be unlike Arecibo in that the surface will be “adaptive”, able to change its shape to create 300-metre sub-dishes than can point up to 40° away from the vertical. Arecibo is only able to point vertically upwards and relies on the rotation of the Earth to sweep it across the sky.

Interesting 2011

Last Saturday I was lucky enough to attend the Interesting 2011 conference, the theme of which was “less yammering, more hammering”. I decided to demonstrate nuclear fission using a thousand mousetraps and thousands of ping-pong balls.

[blackbirdpie url=”https://twitter.com/#!/nickblunden/status/82074467437776896″]
[blackbirdpie url=”https://twitter.com/#!/schauerte/status/82078594364477440″]

It was quite popular with the photographers in attendance and there are quite a few pictures on Flickr.

@Alby - Interesting 2011

Preparing Mousetraps - Interesting 2011

Getting there

1000 Moustraps

[blackbirdpie url=”https://twitter.com/#!/computid/status/82362471461040128″]

Triboelectric envelope

The triboelectric effect (the prefix tribo- comes from the Greek τρίβω for “rubbing” or “friction”) results in the creation of a charge difference between two surfaces: one becomes positive and the other negative. The difference in charge is neutralised when a spark jumps between the two surfaces.

Opening “self-stick” envelopes quite often results in a noticeable triboelectric effect, as I discovered when opening this week’s copy of The Economist.

Tissot’s indicatrix

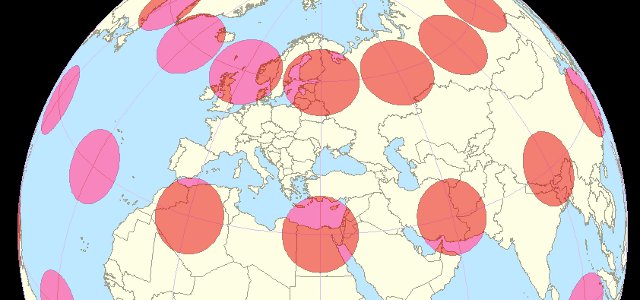
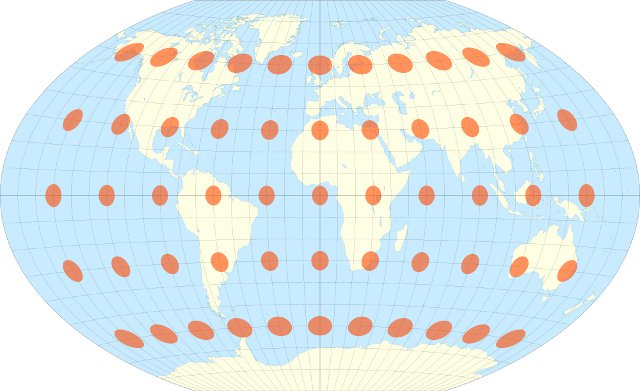
Flat two-dimensional maps are unable to accurately represent the curved three-dimensional surface of the Earth; some distortion of area, shape, distance and/or scale is unavoidable. Tissot’s indicatrix, invented by French mathematician and cartographer Nicolas Tissot, is a method for assessing and indicating the amount of distortion present in a map.

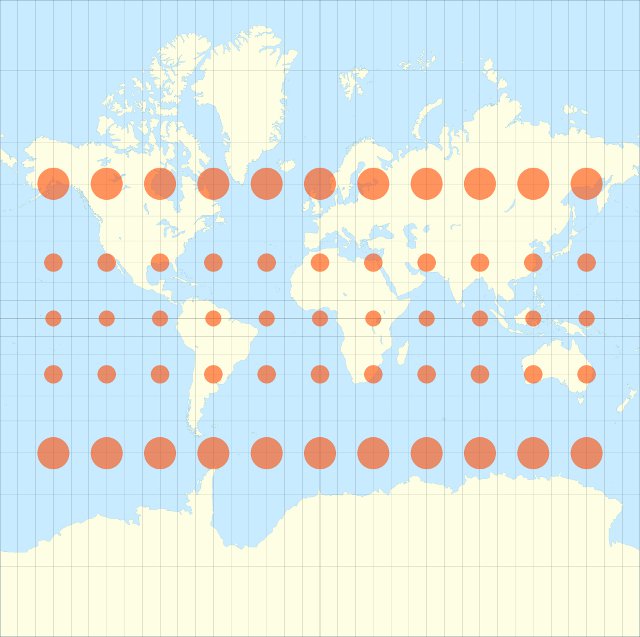
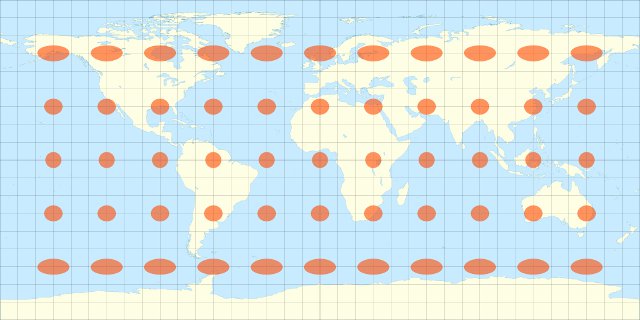
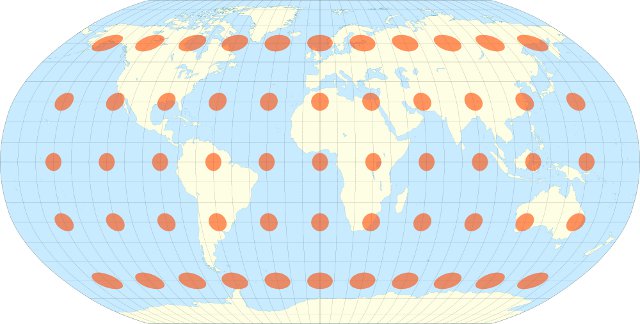
The indicatrix is created by placing an array of tiny circles on the Earth’s surface and then mapping those circles along with the rest of the Earth’s features; the size of the circles is then increased to make them visible.

The Mercator projection maintains correct shapes but exaggerates the size of land masses as distance from the equator increases. On the Mercator projection Greenland appears to have a similar area as Africa, despite being only 7% of the size in reality; it also makes Antartica look much larger than it is.*

The equirectangular projection preserves approximate size at the expense of shape: land masses away from the equator are distorted both horizontally and vertically but distances along meridians (lines of longitude) are preserved.

The use of rectangular projections for whole world maps is now widely discouraged; they are considered suitable only for small areas where any distortion will be negligible.

The non-rectangular Robinson and Winkel tripel projections both attempt to find an acceptable compromise between distortions of shape and distance.

Robinson projection

Winkel III projection

* The Mercator projection’s early popularity was due to its heavy use by sailors – on a Mercator map a constant heading yields a straight line.

Arbitrage at the speed of light

arb·it·rage n /ˈɑrbɨtrɑːʒ/
the practice of taking advantage of a price difference between two or more markets.

The image most people have of stock markets is of men (and it is always men) in suits using hand signals and shouted verbal commands to buy and sell stocks and shares; this system is called “open outcry” and in reality is used only very rarely.

The vast majority of trading now takes place via computer, and this has altered the way in which markets operate. Not only are traders using computers, but now the traders are computers, operating at very high speeds to execute pre-programmed trading strategies.

As computer hardware and software have improved it is no longer the speed at which computers operate that is most important, but rather the time taken for light to travel down the optical fibre between trading locations. Typical trading latencies are now below five hundred microseconds, enabling traders to make more than two thousand trades per second.*

Because the speed of light has become the limiting factor the physical location of trading offices is becoming more and more important. Well-positioned traders (if you’ll excuse the pun) can take advantage of the difference in price between two markets – buying low in one market and selling high in another – for a profit.

For example: imagine three traders buying and selling aluminium on the London Metals Exchange through the LMEselect electronic trading system. One trader is located in London, one in Dubai (5500km from London) and the other in Singapore (10800km from London). The speed of light in an optical fibre is about 200 million metres per second so any change in price reaches the London trader almost immediately but takes 28 milliseconds to reach Dubai and 54 milliseconds to reach Singapore. The trader in Dubai has an extra 26 milliseconds to act – enough time for more than fifty 500 microsecond trades – before the information reaches Singapore. If the trader in Dubai is trading metals in both London and Singapore then it becomes possible to buy low in London and sell high in Singapore before price information can pass between the two.

In a recent paper†, academics Alexander Wissner-Gross and Cameron Freer show that “there exist optimal locations from which to coordinate the statistical arbitrage of spacelike separated securities” and plot these locations on a map.
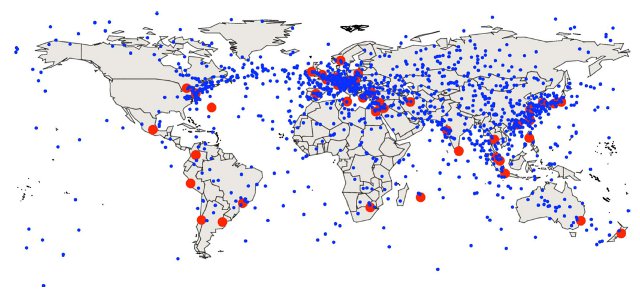

The red dots represent exchanges, the blue dots the optimal location of trading nodes between each pair of exchanges.

As the authors point out:

“[W]hile some nodes are in regions with dense fibre-optic networks, many others are in the ocean or other sparsely connected regions, perhaps ultimately motivating the deployment of low-latency trading infrastructure at such remote but well-positioned locations.”

This suggests that the location of exchanges and the speed of light may become the deciding factors as to where trading offices are sited.

* See, for example, Tara Bhupathi. 2010. “Technology’s Latest Market Manipulator? High Frequency Trading: the Strategies, Tools, Risks, and Responses”, North Carolina Journal of Law & Technology 11(2): 377-400.

† Alexander Wissner-Gross and Cameron Freer. 2010. “Relativistic Statistical Arbitrage”. Physical Review E 82(5): 056104-056110. doi:10.1103/PhysRevE.82.056104