Monthly Archives: June 2014

The Kármán Line

The Kármán Line, at 100 kilometres above sea level, is commonly taken to be the boundary between Earth’s atmosphere and space. But why?

An aircraft generates lift by moving through air.

L=\frac{1}{2} AC_L \rho v^2

where L is the lift generated, A is the wing area, C_L is the lift coefficient, \rho is the density of air, and v is speed through the air.

density-temperature-elevation

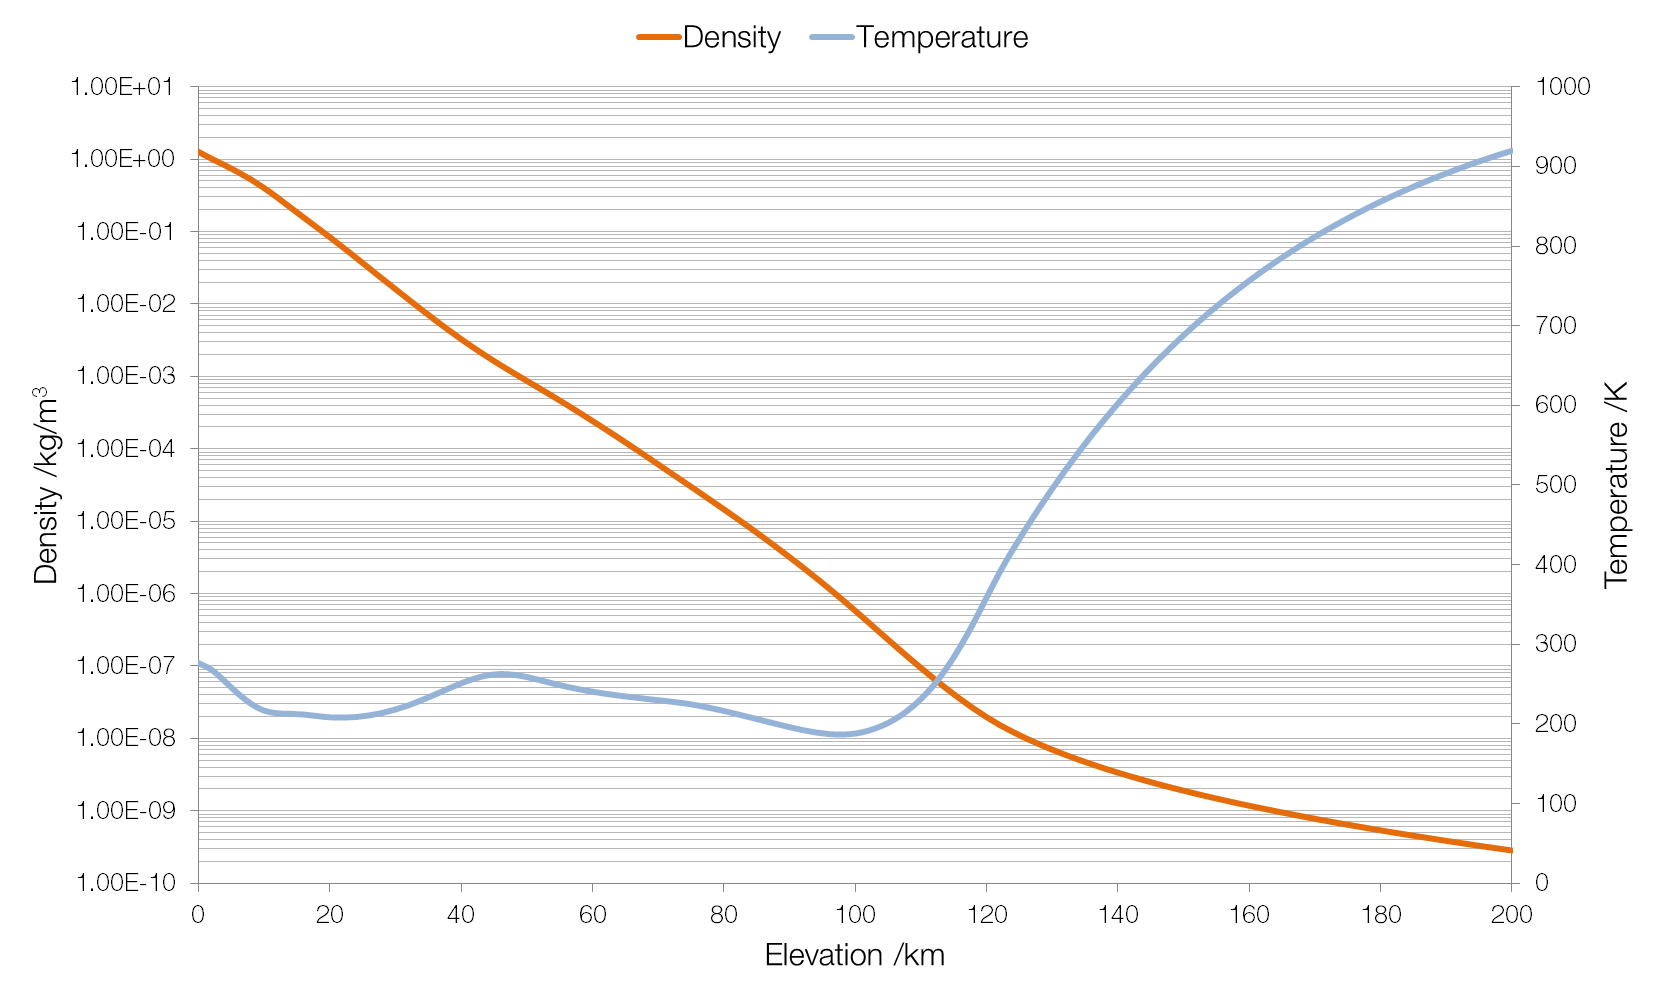
Data from NASA MSIS E-90 atmosphere model. Note that density is plotted on a logarithmic scale and (absolute) temperature on a linear scale.

The density of air changes with elevation (altitude is height above ground, elevation is height above sea level). Therefore, keeping all other factors the same (which would be the case for an aircraft, which cannot change the area of its wings or its lift coefficient), as the air becomes less dense an aircraft must increase its speed to stay airborne. A Boeing 747-400 has a wing area (planform) of 541.2 square metres and a lift coefficient of around 0.5. Assuming that it flies empty, with a mass of 178?800 kilograms (weight 1?754?000 N), the speed it will need to fly to generate the required lift changes rapidly as the air becomes thinner. (At an elevation of 200?km a 747-400 would have to fly at nearly twenty thousand times the speed of sound.)

speed-elevation-boeing-747

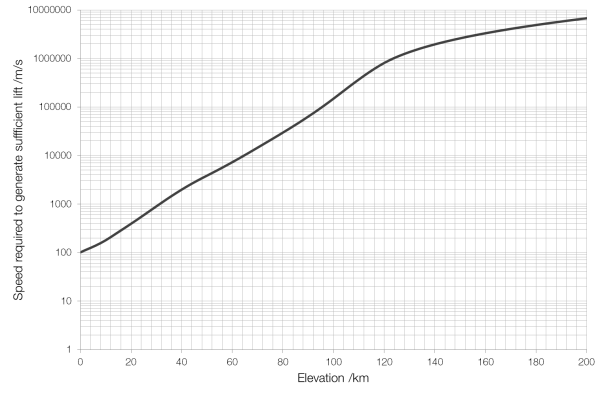
Speed required at elevation for a Boeing 747-400.

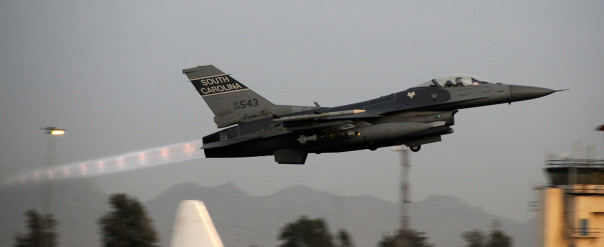
The cruising speed of a 747-400 is about Mach 0.85 or 290 metres per second, which limits the 747-400 to an elevation of around 16 km. (In reality it flies much lower, around 12?km, for safety and fuel consumption reasons.) The record elevation for sustained horizontal flight by a ground-launched aircraft is 36?240 m by a MiG-25M, which was, at the time, one of the fastest military aircraft with a top speed of Mach 2.83.

The Kármán Line, at an elevation of 100?km, is the point at which the atmosphere is so thin (more than a million times thinner than air at sea level) that an aircraft would have to be moving at a speed faster than it could orbit in order to stay in the air. Thus, it is the greatest altitude at which an aircraft could fly in a straight line rather than following the curvature of the Earth.

orbital-speed-requirement

speed-orbit-flight-elevation

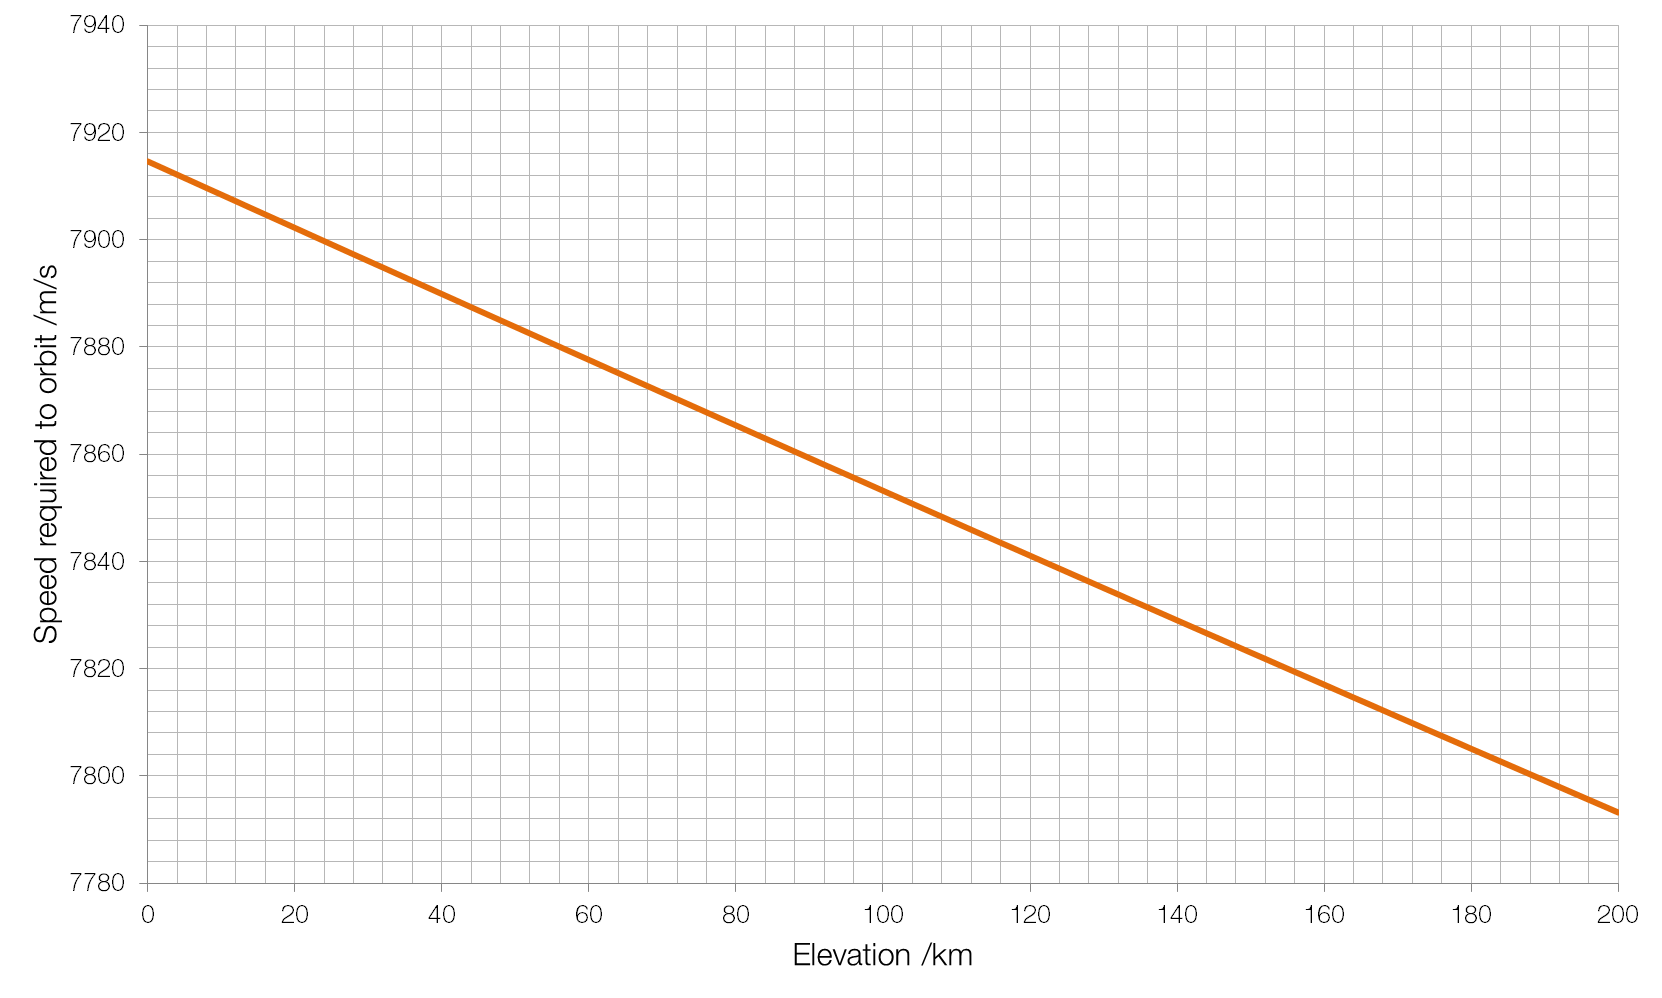
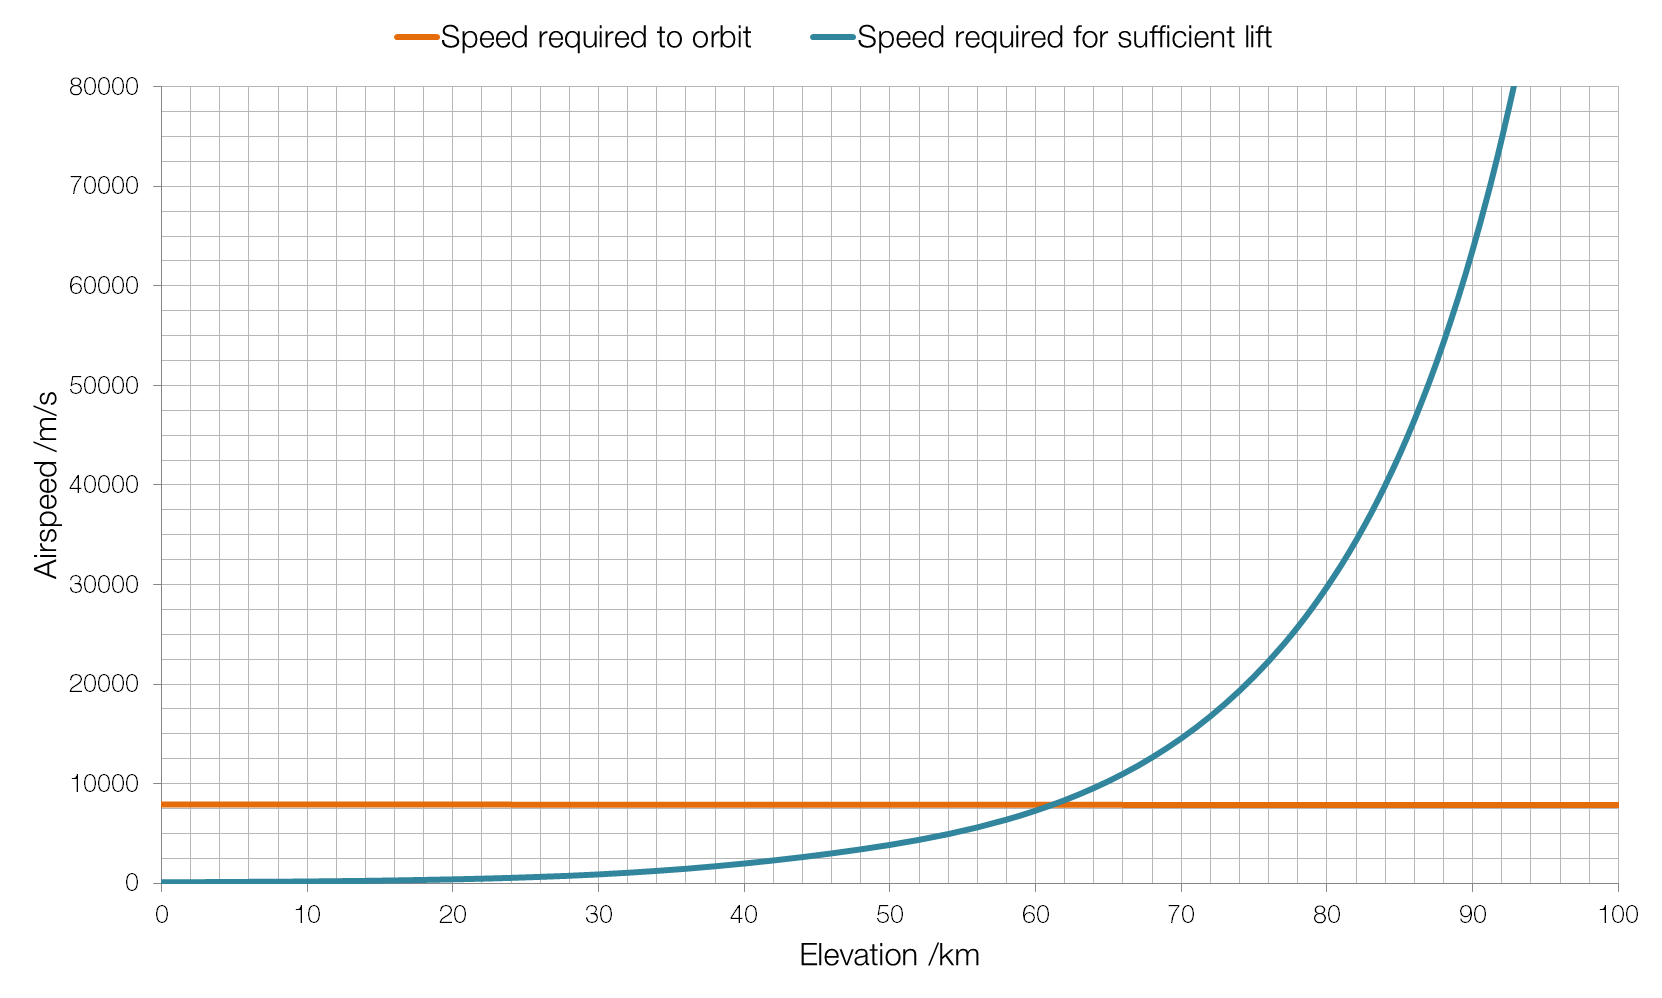
As you can see from the graph above, for our Boeing 747-400, the Kármán Line is around 61?km, rather than the full one hundred kilometres, because the 747-400 is not the most aerodynamic of aircraft, designed for bulk passenger carrying and cost-efficiency rather than performance.

Throats, Nozzles and Shock Diamonds

rocket-engine-shapes

All rocket engines feature a “throat”, a narrowing of the exhaust nozzle. In the photographs above this throat is obvious at the top of the images.

de-laval-nozzle

A de Laval nozzle (also known as a convergent-divergent nozzle) as used in rocket engines.

The question of why rocket engines all feature throats might seem like it has an obvious answer: just try blowing air out of your mouth with your mouth wide open. But the physics behind rocket throats is a little bit more complicated than that.

The nozzle of a rocket engine is designed to accelerate exhaust gases to Mach 1 at the throat, causing a process known as choking or choked flow.

Normally the rate at which a gas can flow out of a pressurised container, such as the combustion chamber of a rocket engine, is limited by the difference between the pressure of the interior of the container and the pressure of the atmosphere surrounding the container: the container tries to push gas out, and the atmosphere tries to push the gas back in. In choked flow, this dependence disappears: the outside pressure has no effect on the rate at which gas is ejected, external pressure cannot force its way past the supersonic shockwave that forms at the throat. Choked flow produces the greatest rate of flow of exhaust gases, and therefore the highest possible thrust: you cannot get the exhaust gas particles to move any faster, but you can push through more of them per second.

As a gas passes through a narrowing in a pipe its pressure decreases and its speed increases; and as the pipe expands the pressure increases and the speed decreases.* This is known as the Venturi effect.

\frac{dv}{v}=\left( \frac{1}{M^2-1} \right) \frac{dA}{A}

Where \frac{dv}{v} 
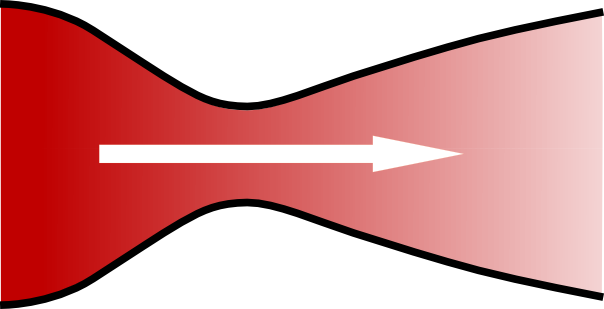
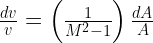
is the rate of change of the velocity of the gas, M is the speed of the gas as a fraction of the speed of sound (i.e. the gas’s Mach number) and \frac {dA} {A} is the change in the area that the gas is flowing through.

There is a limit to the Venturi effect, and that is when the fluid reaches the (local) speed of sound, as happens during choked flow. At this point, the Venturi effect is reversed: instead of the gas slowing as the nozzle expands, its velocity increases (because the \frac{1}{M^2-1} term becomes positive rather than negative).

Thus the shape of a de Laval nozzle is designed to first accelerate the gas (by narrowing) to sonic speeds at the throat, and then because the Venturi effect has been reversed, to accelerate the gas further (by expanding) to supersonic speeds. The faster the exiting exhaust gas is, the more thrust that will be produced.

Once the gas has exited the throat, the shape of the diverging (widening) part of the de Laval nozzle is such that the exhaust gases are directed backwards parallel to the body of the rocket (as shown in the middle diagram below), giving the maximum possible thrust in the direction that you want the rocket is to travel in.

nozzle-expansion

An underexpanded nozzle (top) is inefficient because some of the exhaust gas is propelled backwards at an angle to the rocket’s direction of travel, i.e. pushing it right/left and back/forth rather than up. An overexpanded nozzle (bottom) is more efficient than either of the previous two, but the jet of exhaust that it produces is unstable, which could lead to your rocket veering off course.

The degree of expansion of your nozzle depends on the ambient pressure, and so nozzles are often overexpanded at low altitudes and underexpanded at very high altitudes, giving a “sweet spot” during its journey where it operates at the best possible efficiency.

When a nozzle is over- or underexpanded, a complex process can cause shock waves to form in the exhaust flow. Unburnt fuel passing through these shock waves is compressed and burnt, causing bright “shock diamonds” to form.

shock-diamonds-xcor

Shock diamonds in the exhaust of the XCOR Liquid Oxygen-Methane engine.

shock-diamonds-f16

Shock diamonds in the exhaust of an F-16 during takeoff.

* This is an interesting example of the conservation of energy: the energy of the fluid is a combination of the fluid’s kinetic and potential energies, and as the speed (and therefore the kinetic energy) of the fluid increases, the potential energy (i.e. its pressure) must decrease.

Cousins or Siblings?

Imagine two sets of identical twins: Alice & Amelia, and Bob & Benjamin. Now imagine that Alice marries Bob, and Amelia marries Benjamin, and that both couples have a child: Alice & Bob give birth to Charlie, and Amelia and Benjamin give birth to Catherine.

By law, Charlie and Catherine are first cousins (i.e. the children of your parents’ brothers and sisters are your first cousins). Genetically, however, the situation is very different: Alice and Amelia have the same genes, as do Bob and Benjamin. Charlie and Catherine will get fifty percent* of their genes from each parent, but as their parents are genetically identical they will share fifty percent of their genes with each other (rather than the normal 12.5%), making them genetically brother-and-sister. Also, because their uncle and auntie are genetic clones of their parents, Charlie and Catherine will share 50% of their genes with each of their uncle/auntie, so genetically speaking they would be indistinguishable from parents or siblings.

In the UK, marriages between cousins have been permitted since the time of King Henry VIII. If Charlie and Catherine are legally cousins, but genetically siblings, should they be permitted to marry?

* I should point out that it won’t be exactly 50% in any of these cases, but considering the huge number of genes and the population as a whole the average will be 50%.

Endangerment Categories

The International Union for the Conservation of Nature (IUCN) is an international organisation with the aim of finding “pragmatic solutions to our most pressing environment and development challenges”. One of their most important jobs is assessing the conservation status of various species, which they categorise into one of seven categories in their Red List of Threatened Species.

endangerment-categories

Extinct (EX)

e.g. Dodo, Santa Cruz Pupfish, Cape Verde Giant Skink (799 species total)

Extinct species are those which have no living members (or only one non-pregnant member). Some species that have been considered extinct have been rediscovered.

Extinct in the Wild (EW)

e.g. Hawaiian Crow, Socorro Dove (61 species total)

Species which are Extinct in the Wild are those which live only in captivity or which exist as naturalised populations outside of their normal habitat.

Critically Endangered (CR)

e.g. Blue-throated Macaw, Clifton’s Anguola (4286 species total)

Critically Endangered species are those that face a very high risk of extinction (in the wild). CR species can be considered “possibly extinct”, a category used by BirdLife International, but not by the IUCN.

Endangered (EN)

e.g. Uluguru Dusky Grasshopper, Narcondam Horbill (6451 species total)

Species categorised as Endangered are those that will likely become extinct. Species considered Endangered are often protected by conservation laws that prevent hunting, destruction of habitats, etc.

Vulnerable (VU)

e.g. Ethiopian Banana Frog, Steelhead (10?549 species total)

Vulnerable species are those at risk of becoming Endangered if their habitats are not protected or if other risks to their survival (hunting, disease, etc.) are not mitigated.

Near Threatened (NT)

e.g. American Bison, Northern White Rhinoceros (4822 species total)

Species which are Near Threatened are those which are considered to be at risk of extinction in the near future, but which are not currently considered to be worthy of elevation to a more endangered category.

Least Concern (LC)

e.g. Humans, Cats, Dogs (32?486 species total)

Species in the Least Concern category have been evaluated by the IUCN, and do not qualify for any other categories. Put simply, they are considered to have no risk of extinction.

Data Deficient (DD) and Not Evaluated (NE)

These categories are fairly self-explanatory: either sufficient data on their populations does not exist, or data has not been collected. For obvious reasons, the number of species in these categories is very uncertain. Undiscovered or newly discovered species would fall into these categories until their discovery and/or evaluation.

Why You Shouldn’t Worry About Melting Icebergs

iceberg

When the topic of climate change comes up, a common refrain is that the melting of icebergs is going to drown us all. This is not true. Even if every iceberg in the world melted, we wouldn’t notice the difference.

Archimedes’ Principle states that an object which displaces a fluid (i.e. a liquid or a gas) will experience an upward force that is equal to the weight of the fluid displaced. If an object displaces one cubic metre of water it will experience an upward force of around 9810 newtons, regardless of what it is made from. If its own weight is greater than 9810?N it will sink; if it is less than this it will float.

The density of ice is approximately 920 kilograms per cubic metre, and the density of seawater is approximately 1025?kg/m3. If a cube of ice with sides of one metre is placed into water it will push down on the water with a force of 9030?N (920?kg × 9.81?N/kg), and the water will push upwards on the ice with a force of 10?100?N (1025?kg × 9.81?N/kg). There will therefore be a net upward force on the ice cube of 1030?N and it will float to the surface. However, the ice cube will not float completely above the surface of the water – some of the ice cube will stay submerged.

The volume of the ice cube that is submerged will be equal to the volume of water that has the same weight as the cube itself, or mathematically:

We can find the volume of the ice that is submerged by calculating:

V_{\mathrm{submerged}} \times \rho_{\mathrm{water}} \times g = W_{\mathrm{ice}}

That is, the volume of the ice that is submerged (V_{\mathrm{submerged}}
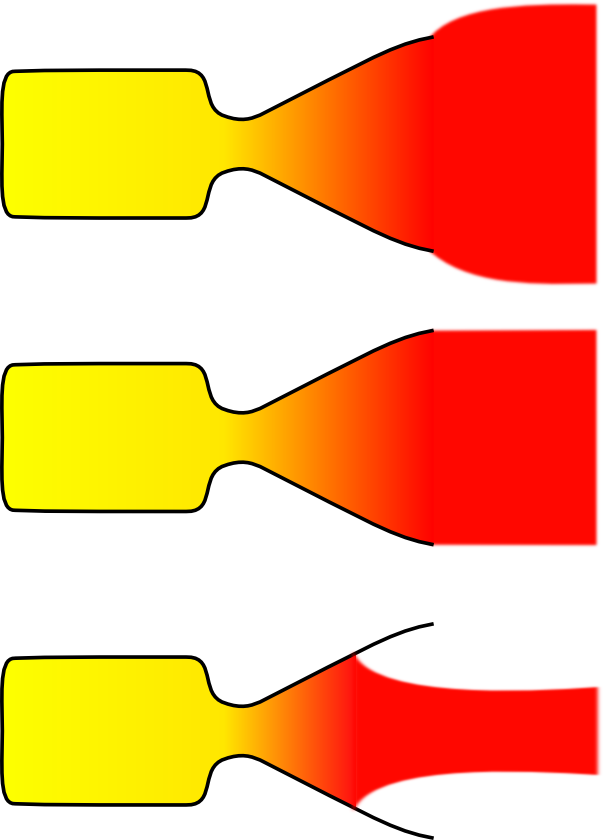
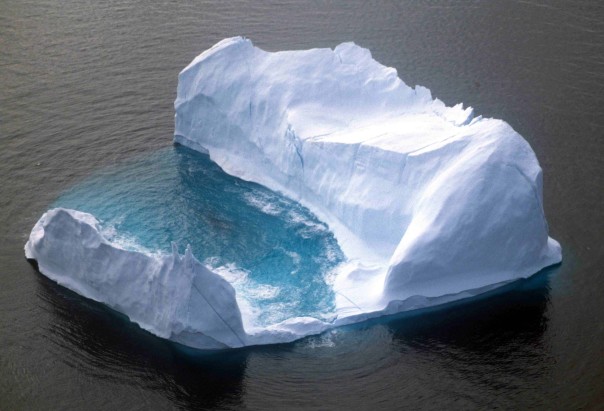
) multiplied by the density of the water (\rho_{\mathrm{water}}) multiplied by the strength of the gravitational field (g) is equal to the weight of the ice cube (W_{\mathrm{ice}}).

An iceberg, with the submerged portion clearly visible underwater.

Using the data we know, we find that the volume of ice submerged is 0.898?m3. This result applies regardless of the shape or size of our ice cube, so we know that 89.9% of any iceberg is below the surface of the water, and 10.2% is above. People seem to be worried that when the ice melts, this above-surface water will be added to the volume of the world’s oceans. However, this fails to take into account the different densities of ice and liquid water. As the ice melts into liquid water its density increases and thus the level of the water remains the same. You can prove this to yourself very easily: place an ice cube into a glass of water, draw a line at the level of the water, and wait for the ice to melt. The level of the water will not climb above your original line.*

What people should be worried about is not icebergs but ice caps. Ice caps are ice that it sitting on land and therefore is not already displacing water. If this ice melts and runs into the oceans it certainly will increase sea levels.

What people should also be worried about is that the density of water changes with temperature. As climate change increases the temperature of the oceans it will expand, and again sea levels will rise.

Note: This is all based on a mathematical-physical model. When other factors are taken into consideration, melting icebergs may contribute very slightly (about 50 micrometres per year) to an increase in sea level.