Monthly Archives: December 2013

Gini Coefficient

The Gini coefficient (named after its inventor, statistician and sociologist Corrado Gini) measures the income distribution of a country’s population. It is often used as an analogue for measuring inequality within a population in general.

gini-map

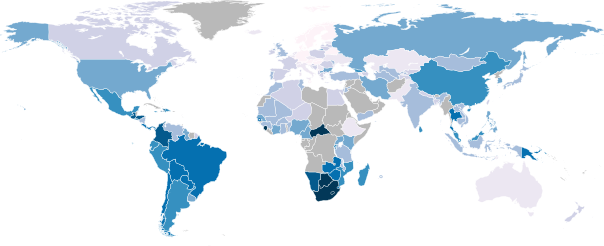
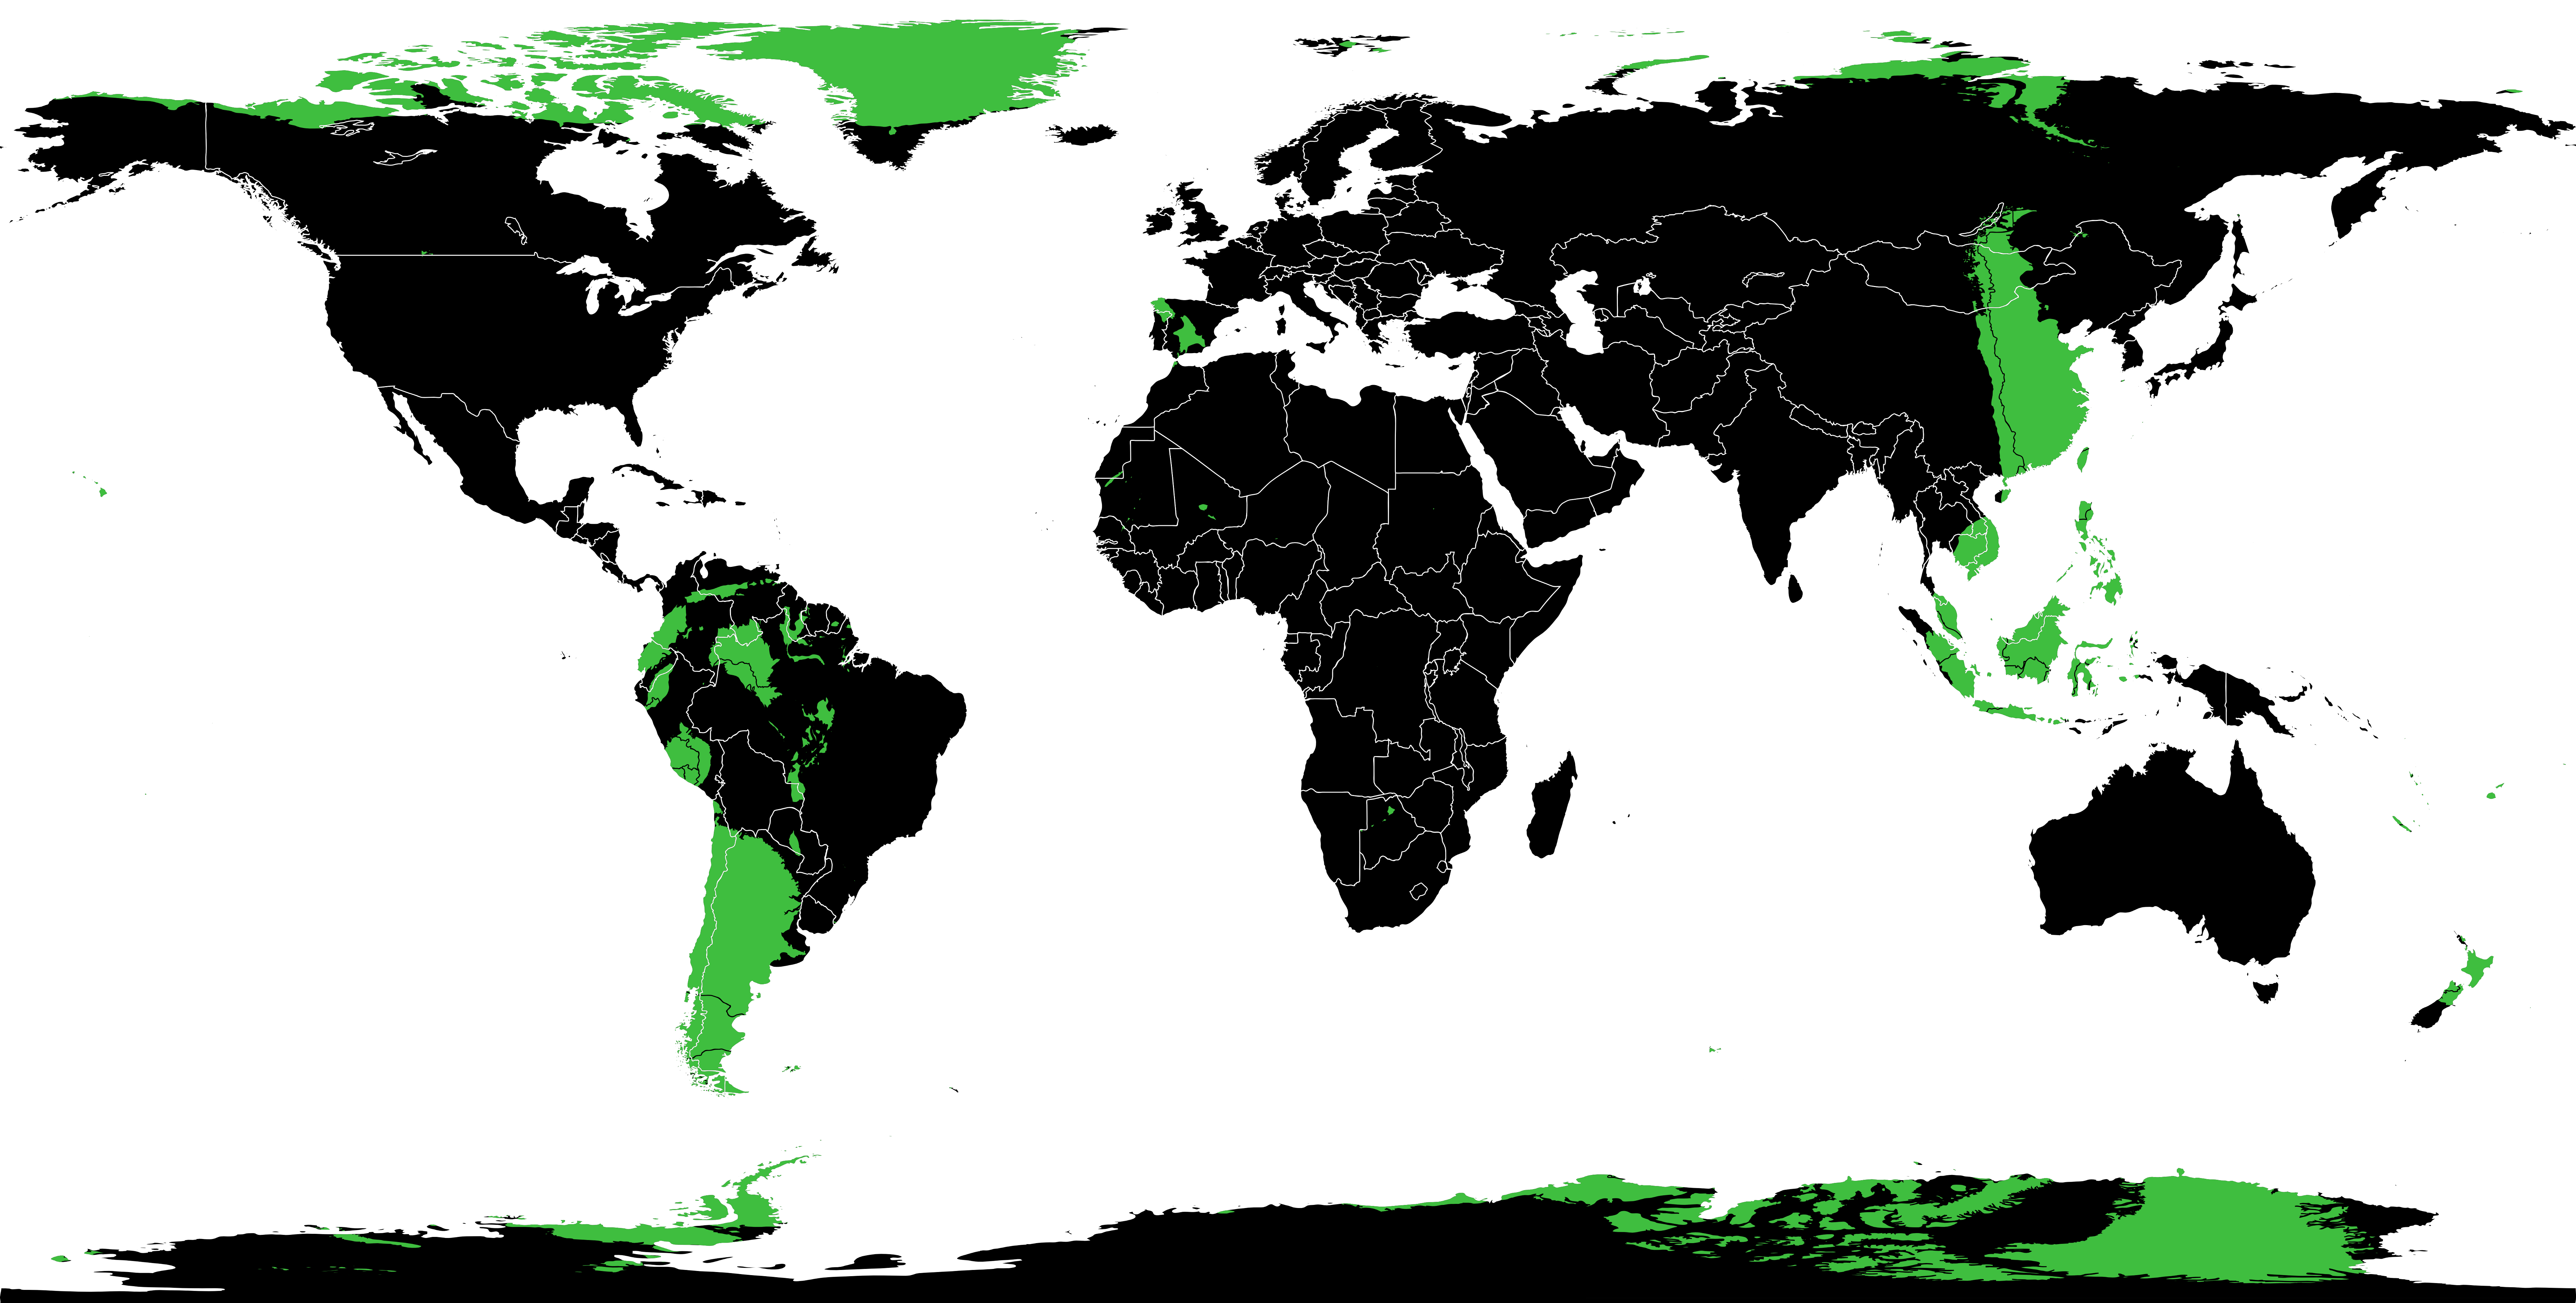
A map coloured by Gini coefficient. Darker blues represent higher Gini coefficients (greater inequality).

A Gini coefficient of zero represents perfect income equality (everybody ears exactly the same amount) and a Gini coefficient of one represents perfect inequality (one person in the population earns all the money). Denmark has the lowest Gini coefficient (0.24) and the Seychelles the highest (0.66); the UK has a Gini coefficient of 0.34 and the US 0.45.

Consider three hypothetical ten-person countries:

Country Randomland Inequaliteria Equalistan
Citizen #1 49755 500000 50000
Citizen #2 61429 10 50000
Citizen #3 80411 10 50000
Citizen #4 45021 10 50000
Citizen #5 68466 10 50000
Citizen #6 96746 10 50000
Citizen #7 18788 10 50000
Citizen #8 71039 10 50000
Citizen #9 79777 10 50000
Citizen #10 10258 10 50000
Gini Coefficient  0.250 0.900  0.00

Another way of measuring income inequality is the Robin Hood index, which indicates the portion of a country’s total income that would need to be taken from the richest half of the population and given to the poorest half of the population in order to achieve income equality. For Randomland the Robin Hood index is 18.71%, for Inequaliteria it is 90% and for Equalistan it is 0%.

Earth Sandwich

What is the significance of the areas highlighted in green on the map below?

earth-sandwich-results

Click for a much larger version.

The highlights indicate areas where there is land on both sides of the globe – that is, areas where you could create a successful Earth Sandwich.

For example, if you started in Northern Argentina and drilled through the Earth’s core you would end up in Southern China. If instead you started in southern Argentina you’d end up either in Mongolia or Russia. It’s a little bit easier to understand if you look at the overlaid maps below.

earth-sandwich-overlay

There are significant areas of overlap between South America and around the South China Sea, and between Northern Canada & Greenland and the Antarctic.

There are also some interesting smaller spots, for example where Spain/Portugal (and a tiny portion of Morocco) and New Zealand overlap, or the Islands of Hawai’i and Botswana.

spain-nz

Spain/Portugal/Morocco and New Zealand

hawaii-botswana

Hawai’i and Botswana

The EURion constellation

Take a look at the banknotes below. What do they have in common?

uk-poundeuro-euroaustralia-dollar bulgaria-lev canada-dollar chile-peso mexico-dollar romainian-leu singapore-dollar swaziland-lilangeni uae-dirham

Did you spot it? Each of the banknotes above (and many, many others) include the EURion constellation somewhere in their design.

eurion-examples

The EURion constellation is a pattern of five rings, arranged in a rough ‘X’ shape, used by banks to identify to scanners, photocopiers/printers and software that they should not reproduce the object being imaged. If you try to image a banknote that includes the EURion constellation on modern hardware or software you will generate an error, or print a blank or full-black page.

Some banknotes attempt to embed the EURion constellation into their design: for example, the Australian dollar above uses them as “leaves” on a tree to the right of Catherine Helen Spence’s head; and US dollar notes use the zeroes in the bill’s denomination (10, 20, 50, 100). The circles that make up the constellation are often printed in yellow, or another colour so that they blend in with their background.

The EURion constellation is not the only method used to protect banknotes, as Markus Kuhn, the discoverer of the EURion constellation has noted.

Jerk, Jounce, Snap, Crackle and Pop


Physicists are obsessed by rates: how quantities change over time. The rate of change of the number of nuclei in a radioactive sample tells us how radioactive something is; the rate at which the chemicals in a reaction change tells us how reactive something is; and so on.

If we start by looking at the displacement of an object (i.e. the distance from where it started to where it currently is) then when we look at the first derivative (by time) of displacement, (i.e. dividing the displacement of an object for how long it took to be displaced) we have calculated the object’s velocity.

v = \frac{dx}{dt}

If we look at the rate of change of velocity, the second derivative (by time) of the object’s displacement (i.e. the rate of change of the rate of change of its displacement), then we have calculated the object’s acceleration.

a = \frac{dv}{dt} = \frac{d^2x}{dt^2}

If we now look at the rate of change of acceleration, the third derivative of the object’s displacement (i.e. the rate of change of the rate of change of the rate of change of its displacement) then we have calculated the object’s jerk.

j = \frac{da}{dt} = \frac{d^2v}{dt^2} = \frac{d^3x}{dt^3}

The first two derivatives of displacement, velocity and acceleration, are well known and reasonably well-understood by most people. But jerk is a little bit more difficult to understand. If we apply a force to an object it will accelerate, and we usually assume that this force is applied instantaneously. But this is not correct – it takes time to apply a force. As a result, the rate of acceleration will not be constant, and thus we have the jerk.

It may be easier to understand the concept of a third derivative by looking at an example from economics: inflation. US President Richard Nixon once famously said “the rate of increase of inflation is decreasing”, using a third derivative in the process.

The rate of inflation is the rate at which prices increase over time, and this is therefore the first derivative of price. The rate of the increase in inflation is a second derivative, and if this itself is decreasing then that is a third derivative. That is, in Nixon’s case, prices were increasing (i.e. inflation was positive), and this rate of inflation was itself also increasing, but the rate at which it increasing was decreasing.

The fourth derivative of an object’s displacement (the rate of change of jerk) is known as snap (also known as jounce), the fifth derivative (the rate of change of snap) is crackle, and – you’ve guessed it – the sixth derivative of displacement is pop. As far as I can tell, none of these are commonly used.