Monthly Archives: April 2015

The Nuclear Double Flash

Identification of a nuclear explosion uses a number of different methods. The Comprehensive Test Ban Treaty Organisation (CTBTO) runs a series of networks which listen for infrasound sound waves produced in the atmosphere by above-ground explosions; which monitor the oceans for underwater tests; and which monitor seismic activity to detect underground tests. The CTBTO also run a network of radionuclide sensors that sample the air to detect certain isotopes produced by nuclear explosions.

But if a nuclear weapon is ever used again as a weapon of war, the first notification will come from space-based networks (e.g. the US DSP or the Russian Oko) looking for the characteristic double flash of a nuclear detonation.

 
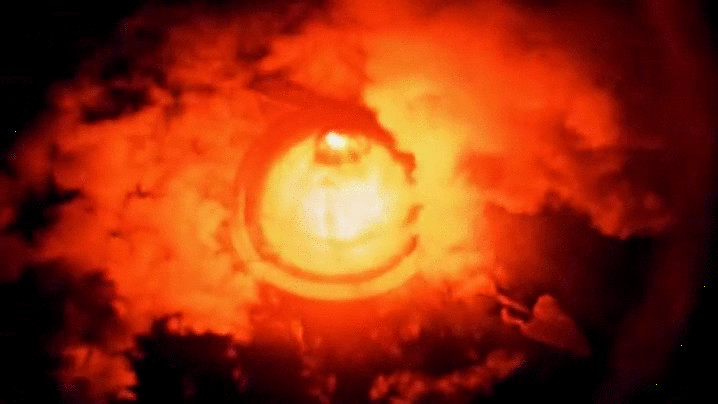
Watch the video above of the first two seconds of the Castle Bravo nuclear test. Do you notice anything unusual? Let’s take a look at a few individual frames.

frame-27

Frame 01

frame-38

Frame 11

frame-60

Frame 49

The explosion begins bright, but then dims before becoming bright again: this is the nuclear double flash. It’s a little easier to see in the slowed-down excerpt below.

 
The variation in the brightness of the light emitted by a nuclear explosion follows a distinct pattern. It is possible to build light sources that are as powerful as nuclear explosions, or to produce light sources that have the same double flash characteristics, but not to produce a source with both characteristics. Thus the nuclear double flash is taken as irrefutable evidence that a nuclear explosion has taken place.

double-flash-graph

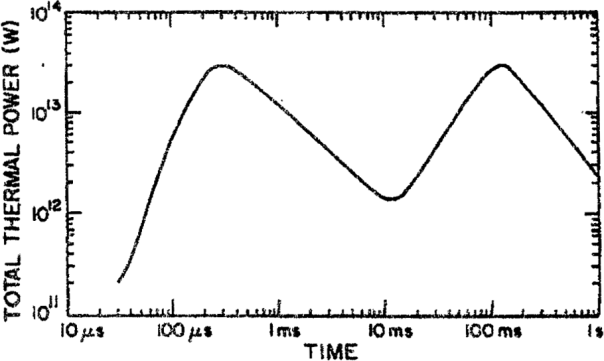
Note the logarithmic scale on both axes.*

As the nuclear explosion begins, the bomb and all of its components are heated to extremely high temperatures of around ten million kelvin. This causes these components to emit low-energy (“soft”) x-rays and high-energy (“hard”) ultraviolet waves. These x-rays and UV waves are absorbed by the air within a few metres of the device and this causes the air to be heated to temperatures of around one million kelvin, causing it to become incandescent and emit light. This is responsible for the initial, very fast (about three hundred millionths of a second after detonation) bright peak.

At the same time, the explosive shock wave itself (the hydrodynamic front) is expanding outwards and quickly compresses the air in front of it like a piston, causing it to become superheated. Inside this shock wave, the temperature is so high that the gas inside it become completely ionised (i.e. the gas becomes a plasma) and this makes the shock wave opaque to light. The brightness minimum is therefore caused by the shock wave “trapping” light behind it as it forms.

Light is still emitted because the shock wave itself is incandescent and is therefore emitting light outwards, ahead of itself, but this light is about one-tenth of the brightness of the preceding and following maxima. As the shock wave expands, it cools rapidly, and as it cools it becomes more transparent, allowing the light previously trapped behind it to escape. This is responsible for the second bright peak, which lasts much longer than the first because the full energy of the weapon is now being fully released, with nothing to block it. As the fireball expands it dissipates, and this is responsible for the gradual decrease in brightness.

yield-time-graph

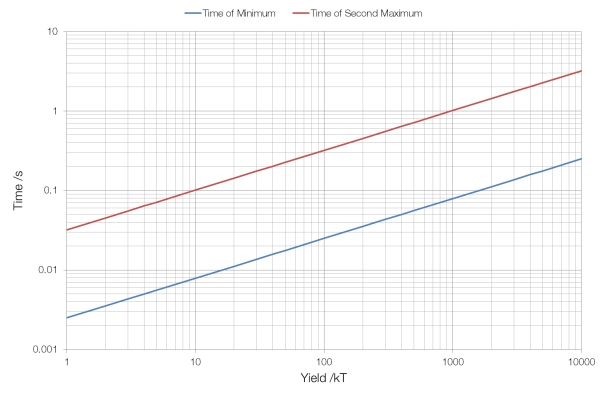
As the graph above shows, the time of the first minimum and the time of the second maximum depend on the weapon’s yield. A larger yield means a more powerful initial release of energy, and a more powerful shock wave, and this shock wave then takes more time to “pass through” the initial hot region created by x-ray/UV absorption, and then also takes longer to cool down to the point at which is becomes transparent to the light that it has trapped behind it.

For a one kiloton device, the time between the minimum and the second maximum is only 30 milliseconds, too short a gap for the human eye to perceive, but bhangmeters aboard satellites can spot it (and by measuring the time interval get a rough idea of the weapon’s yield). For larger weapons, such as the 100 kT warheads aboard the UK’s Trident II D-5 missiles, the interval is long enough (0.3 seconds at 100 kT) for human beings to perceive.

* Taken from Guy E. Barasch, “Light Flash Produced by an Atmospheric Nuclear Explosion”, LASL-79-84, Los Alamos National Laboratory, 1979.

A More Logical System of Coinage

(Please note: I didn’t say this was necessarily a better system, just that it is more logical. I still can’t believe I spent this much time on this total non-issue.)

There are many, many currency redesigns on the internet. But everybody always concentrates on redesigning the paper currency; very rarely does someone look at redesigning the coins. I’m far from a  graphic designer, but what I can do is look at the size and shape of the coins.

Here is what current UK coinage looks like:*

Coin Diameter /mm Thickness /mm Mass /g Material
1p 20.3 1.65 3.56 Copper-plated steel
2p 25.9 2.03 7.12 Copper-plated steel
5p 18.0 1.7 3.25 Nickel-plated steel
10p 24.5 1.85 6.5 Nickel-plated steel
20p 21.4 1.7 5.0 Cupro-nickel (84:16)
50p 27.3 1.78 8.0 Cupro-nickel (75:25)
£1 22.5 3.15 9.5 Nickel-Brass
£2 28.4 2.50 12.0 Cupro-nickel and
Nickel-Brass

Clearly this makes no sense at all. The 1p and 2p coins are both bigger than the 5p, and the 10p is bigger than the 20p. The 2p coin is heavier than the 1p, 5p, 10p and 20p coins. There are four different materials used, and even though both the 20p and 50p coins are made out of cupro-nickel, the copper-to-nickel ratio is different, which must make manufacturing them more difficult.

Step 1: Get rid of the 1p and 2p

There are a number of reasons for doing this. The 1p and 2p coins are now essentially useless for actually buying anything (which is why many countries have got rid of their 1p/2p equivalents), and the UK 2p coin is particularly big and heavy. Also, it will help when we want to scale the sizes of coins logically.

Step 2: Make coins from the same material

Since we have a fiat money system, we don’t need coins to be made out of different materials, and visual appearance isn’t important, as people will be able differentiate between our new coins using other factors. We should just use the cheapest material, which is nickel-plated steel.

Step 3: Make the sizes more logical

As demonstrated above, the sizes of UK coins currently makes no sense. We want the size of our coins to be proportional to their value, so that the £2 is larger than the £1, and the £1 is larger than the 50p and so on. (This has the useful side effect of making less “powerful” or less “useful” coins smaller and lighter, so that they take up less space in your wallet.)

However, given that we don’t want our new coins to be significantly smaller or larger, or lighter or heavier than our existing coins, we cannot vary size linearly with value. If we did this then the £2 coin would be forty times bigger than the 5p coin, and one of them would have to be either unmanageably small or unmanageably big.

We will therefore have to use a logarithmic system to calculate the new sizes (this makes sense because people’s cognition of numbers is naturally logarithmic). Thus a £2 coin will be bigger than a £1 coin, but not twice the size; and a 50p coin will be bigger than a 10p coin, but not five times bigger.

We don’t want any coin to be smaller than the 5p (the coin with the lowest diameter) or the 1p (the coin with the lowest thickness), or to be larger than the £2 (the coin with the highest diameter) or the £1 (the coin with the highest thickness). Thus we will take the measurements of these coins to be our limits: our new coins must have diameters between 18.0 and 28.4 mm, and thicknesses between 1.65 and 3.15 mm.

After some relatively simple calculations, we end up with the following:

Coin Diameter /mm Thickness /mm Mass /g
5p 18.0 1.65 3.13
10p 20.0 1.93 4.50
20p 21.9 2.21 6.22
50p 24.5 2.59 9.08
£1 26.4 2.87 11.74
£2 28.4 3.15 14.87

new-coins-3d

Old £1 coin shown above for scale.

coin-comparisons

Most of the coins are similar in size (the 5p and £2 have exactly the same diameters), but there are a couple of notable differences.

coin-comparison-detail

The change in properties are easier to understand via graphs.

As you can see, the proposed diameter and thickness increase sensibly, whereas the existing diameters and thicknesses do not. The same is also true for the proposed masses.

proposed-coin-masses

As you can see, the proposed masses are higher than the existing masses for all but the 5p and 10p coins. However, considering the removal of the 1p and 2p coins and after running some extensive Monte Carlo testing, I can confidently say that your average pocket full of change will now weigh less. (It would not be difficult to use a less dense material than nickel-plated steel if weight proved to be a problem. We could also reduce the thicknesses of the coins, making the 2.5 mm thickness of the £2 coin our maximum.)

The logic of using a logarithmic system is further demonstrated when considering adding the £5 coin (which is really only a collectors’ item) into our system. The existing £5 coin is enormous: 39 mm in diameter and 28 grams in mass; in our new system it is a svelte 31 mm and only 19.8 grams. We could therefore replace some of our paper money, which requires frequent costly replacement, with longer-lasting coins.

Existing £1 and £2 coins shown for scale.

Known Issues

Use by the blind

Unlike the current system, our new proposed system uses only circular coins: we do not use shapes of equal width as with the current 20p and 50p coins. This could make them more difficult for blind users to deal with.

Our new coins have a greater variation in mass than the existing coins, and this should make differentiating between them by feel easier. Also, the diameter:thickness ratio changes more noticeably (and of course, more consistently) than existing coins: coins become “fatter” relative to their diameter as their value increases.

diameter-thickness-ratio

The problem of blind users is easily fixed by using different edges on our coins, as is currently done with Euro coins: the 2¢ coin has a groove around its edge, the 10¢ coin has fine “scallops” on its edge, the 20¢ coin uses a “Spanish Flower” design, the €1 coin uses interrupted milling and the €2 uses a fine-milled edge with lettering. There are more than enough different options for blind users to easily differentiate between coins.

euro-cent-edges

My choice would be for every second coin (i.e. 10p, 50p and £2) to use a scalloped edge, as the remaining coins would then different enough either by size or by feel (the scallops are easier to feel than fine milling) to differentiate between. Obviously, extensive testing with blind users would be necessary to iron-out any problems.

Other Issues

None. This is clearly a brilliant idea.

* The difference in the number of significant figures should correspond to different tolerances, but I wouldn’t be surprised if it’s a mistake by the Royal Mint.