Tag Archives: energy

Why 80mph is not a good idea

The UK government has announced that it is beginning a consultation on raising the speed limit on UK motorways from 70 mph to 80 mph. I don’t think this is a very good idea, and my reasons are listed below.

Time Saving

You simply don’t save that much time by increasing your speed to 80 mph. If you drove the 400 mile distance from London to Edinburgh, you would only save three-quarters of an hour, and that assumes that you maintain a constant speed of 80 mph the entire time, neither accelerating or decellerating.

Assuming no acceleration or deceleration is entirely unrealistic and as it takes longer to accelerate to 80 mph than it does to get to 70 mph, the graphs above represent a best case scenario. The real time savings are likely to be much lower.

Kinetic Energy and Stopping Distance

Kinetic energy at different speeds for my car, a Peugeot 207 with a mass just over 1000 kg.

The kinetic energy of a vehicle is what makes it dangerous; transferring that kinetic energy to an object – be it a pedestrian or another car – is what causes damage. Kinetic energy depends on the square of the speed; if you double the speed of an object you quadruple its kinetic energy. An increase in speed from 70 mph to 80 mph is a 14% increase in speed but this results in a 31% increase in kinetic energy, making the car – in a sense – 31% more dangerous to other road users.

Increasing kinetic energy also increases stopping distance. Increasing the speed limit to 80 mph would increase the average stopping distance on motorways to 120 metres (30 car lengths!), a 25% increase on the 96 metre stopping distance found at 70 mph.

Fuel Economy

The relationship between speed and fuel economy is not linear; fuel economy is poor at both low and high speeds and peaks somewhere between 40 and 60 mph. Driving at 80 mph will decrease fuel economy and therefore increase fuel consumption; fuel costs will be higher and CO2 (and other harmful gas) output will be higher. Our limited supply of petrol will be depleted faster if we all drive at 80 mph than if we drive at 70 mph.

UK Energy Mix

A lot of people get confused between the electricity they use and the energy they use.

It’s easy to forget that the majority of people use natural gas for heating (e.g. a gas-fired central heating system) and cooking and petrol for transport; electricity only makes up a small part of the mix.

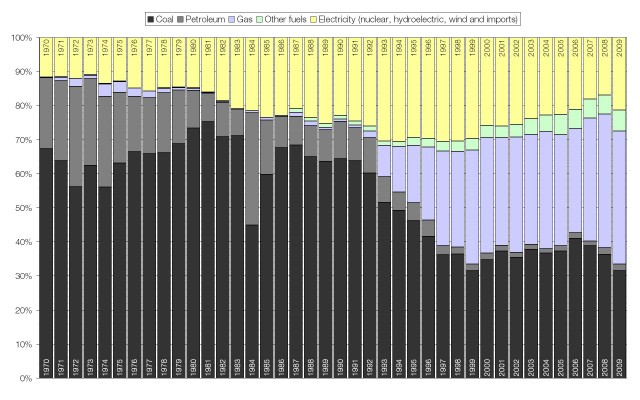
The graph below shows how the UK’s “energy mix” has changed over the last forty years.

Electrification peaked between 1994 and 1998, the same time that nuclear power was at it’s peak in the UK. Greater electrification would be a benefit to the environment as electricity is a low-carbon fuel, especially when nuclear and renewables make a large contribution to the fuel mix. Also the “Dash for Gas” in the ’90s is clearly visible as a very marked increase in the size of the blue section.

Electricity consumption in the production of aluminium

Aluminium is a very useful metal; it is the most widely used non-ferrous* metal in the world. It has a very low electrical resistance and a very good strength-to-weight ratio and has therefore found many applications: from packaging in drinks cans and foil wrapping to aeroplane parts and power lines.

Luckily, aluminium is very common, making up about 8% by mass of the Earth’s crust (only silicon and oxygen are more abundant). Unfortunately aluminium is also very reactive so is never found in isolation like gold and silver are, but rather as a compound in one of 270 different minerals.

Aluminium is usually produced by extracted from bauxite, an ore made from a mixture of aluminium hydroxide, iron oxide, titanium dioxide and kaolinite.† Because it is so reactive aluminium cannot be extracted economically using chemical processes; instead it is extracted by electrolysis in the Hall-Héroult process.

A bank of Hall-Héroult cells

The Hall-Héroult process uses a huge amount of electricity; hundreds of thousands of amperes are used in each cell and a single plant may contain hundreds of cells connected in series. According to Alcoa, the world’s largest producer of aluminium, the best smelters use about 13 kilowatt hours (46.8 megajoules) of electrical energy to produce one kilogram of aluminium; the worldwide average is closer to 15 kWh/kg (54 MJ/kg).

Worldwide production of aluminium in 2010 was 41.4 million tonnes. Using the figures above this means that 621 billion kilowatt hours of electrical energy were used in the production of aluminium. To put that in perspective, the total world production of electrical energy was 20261 billion kilowatt hours, meaning that more than 3% of the world’s entire electrical supply went to extraction of aluminium.

During the same period Australia, one of the world’s largest producers of aluminium‡, produced about two million tonnes of aluminium and 250 billion kilowatt hours of electrical energy; this means that more than 12% of its electrical supply was used to extract aluminium.

The output of the Kárahnjúkar Hydroelectric Plant in Iceland is devoted entirely to the Fjardaál aluminium smelter. There has been a great deal of conflict about the environmental impact that the building of this dam has created. (via @declanfleming.)

* The ferrous metals are those that contain iron; steel is the most common ferrous metal.

† Bauxite contains aluminium in gibbsite, boehmite and diaspore; iron in goethite and haematite; aluminium and silicon in kaolinite; and titanium in anatase.

‡ Australia is the world’s fourth largest aluminium producer and the largest producer, by a very substantial margin, of both aluminium oxide and raw bauxite; the red colour of Australia’s deserts comes in a large part from the presence of bauxite.

Fuel Mix and CO2

Since 2005 UK electricity suppliers have been legally obliged by Ofgem to provide information about the fuel mix they use to generate electricity and the carbon dioxide they produce in the process.

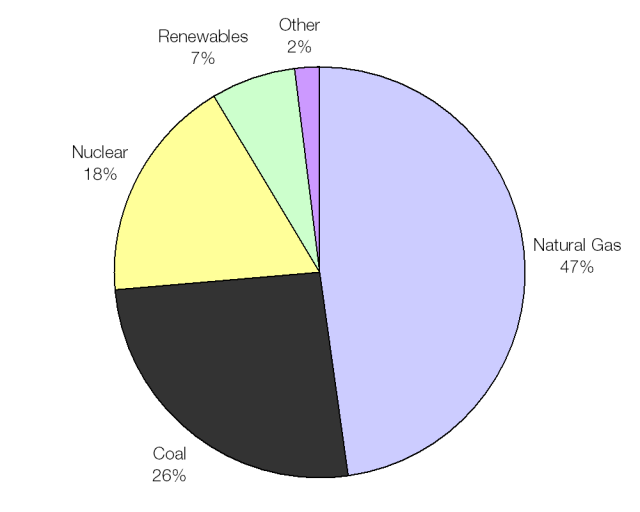
The UK average fuel mix; heavy on gas and coal.

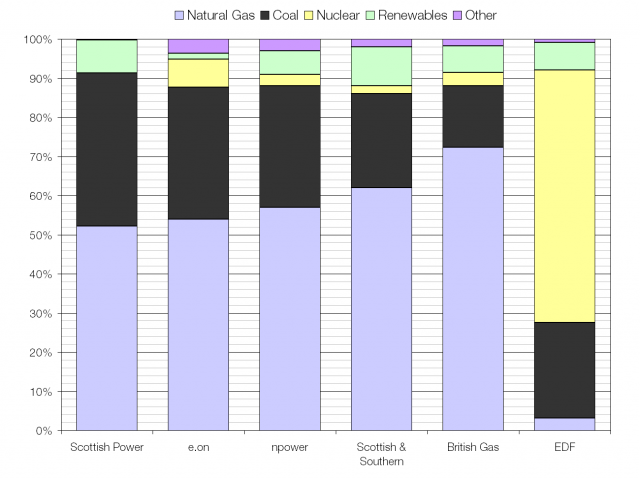
The “Big 6” energy suppliers supply 99% of the UK population between them; most have a fairly similar energy mix, but one stands out from all the rest.

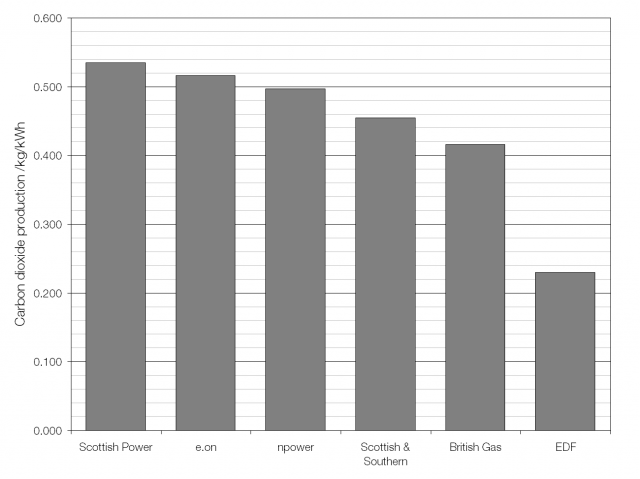
Most of the Big 6 are heavily reliant on natural gas and coal; but EDF stands out by generating more than 60% of its electricity from nuclear power. The effect that this has on the amount of CO2 that it creates for every kilowatt-hour of energy produced is very noticeable.

EDF Energy is a subsidiary of Électricité de France, so it’s no surprise to see it relying on nuclear power; France generates 78% of its electricity from nuclear power and is the world’s largest electricity exporter. This has enabled Électricité de France to become the world’s largest utility company.

Source for fuel mix data: ElectricityInfo.org

Estimating energy usage and savings

There’s a fascinating paper in this week’s Proceedings of the National Academy of Sciences of the United States of America (PNAS) journal about people’s perceptions of the energy used and saved by various devices and methods.

The researchers’ conclusions are not good news, especially in the light of the energy savings that are required to reduce anthropogenic climate change:

“[P]articipants in this study exhibited relatively little knowledge regarding the comparitive energy use and potential savings related to different behaviours … [they] were also … unaware of differences for some large-scale economic activities … and everyday items.”

The researchers recruited 505 volunteers using Craigslist (which must introduce an interesting set of biases) and asked them to estimate the amount of energy used by various household devices, and to estimate the amount of energy saved by various methods.

On average the study’s participants underestimated the energy used or saved by a factor of 2.8; people estimate that a device using 1000 watts of electrical power actually only uses 350W and a method that saves 500W would be estimated to save only 180W.

Participants did understand that energy savings were possible, but underestimated the size of the saving. For example, participants knew that a laptop computer used less power than a desktop computer, but thought that the saving was less (23W) than it actually was (92W). The more energy a device/method used or saved, the less accurate participants were. Participants estimated that transporting goods by truck used about the same amount of energy as transporting by train or ship, despite the fact that trucks actually use ten times as much energy: they overestimated the use of energy by ships and trains and underestimated trucks and aeroplanes.

In this graph from the paper overestimates appear above the dashed line and underestimates below.

The activity most commonly selected in answer to a question about the single most effective thing participants could do to save energy was “turn off lights”, whereas in reality resetting the thermostat or washing clothes on a colder setting would save far, far more energy. Far more participants selected “curtailment” activities (e.g. turning off lights, not using the car) as saving more energy than “efficiency” activities (e.g. switching to compact fluorescent lightbulbs) despite the fact that the opposite is most likely correct.*

* See Gardner, G. and Stern, P. (2008) The short list: the most effective actions US households can take to curb climate change, Environment Magazine, 50, pp. 12-24. Link