Volcanic Explosivity Index

Invented in 1982 by Chris Newhall and Stephen Self, the Volcanic Explosivity Index (VEI) is a bit like a Richter scale for volcanoes.

The VEI measures the “explosiveness” of a volcanic eruption, and takes into account the amount of material ejected, the height to which the material is ejected, and how long the eruption lasts. The scale runs from 0 (“effusive”) to 8 (“apocalyptic”), and is logarithmic from VEI-2 onwards (so VEI-3 is ten times more explosive than VEI-2, etc.).

VEI Classification Material ejected /km3 Plume height /km
0 Effusive < 0.000 01 < 0.1
1 Gentle > 0.000 01 0.1-1
2 Explosive > 0.001 1-5
3 Catastrophic > 0.01 3-15
4 Cataclysmic > 0.1 10-25
5 Paroxysmic > 1 20-35
6 Colossal > 10 > 30
7 Mega-colossal > 100 > 40
8 Apocalyptic > 1000 > 50

Newhall and Self’s original paper contains a list of eruptions by VEI running back to 1500 (note their footnote about reporting at the bottom of the table).

vei-list

The paper only lists one VEI-7 event, the “Mega-colossal” eruption of Mount Tambora in Indonesia in 1815 that caused The Year Without a Summer. They state that VEI-8 eruptions should occur with a frequency of ? 10 000 years, with the most recent being the eruption of New Zealand’s Taupo Volcano around 26 500 years ago.

How to Look at the Back of Your Head Using a Black Hole

A_Horseshoe_Einstein_Ring_from_Hubble

A black hole is created when matter is compressed into such a small volume that the gravitational field that it creates becomes so strong that light cannot escape. The size that an object needs to be compressed to is called the Schwarzschild radius, and is given by a simple equation:

r_S = \frac{2GM}{c^2}

where r is the Schwarzschild radius, G is the constant of universal gravitation, M is the mass of the object, and c is the speed of light. There is no lower limit to the mass M involved: even the Earth could become a black hole if it were compressed into a ball less than eighteen millimetres across.

A black hole has no physical size (it is a singularity) but the “edge” of a black hole is usually taken to be its event horizon: the point beyond which even light cannot escape. The distance of the event horizon from “centre” of a black hole is equal to the black hole’s Schwarzschild radius. If some familiar objects from our solar system were to become black holes, their event horizons would be as follows:

Object Event Horizon
Earth 8.87 mm
Saturn 84.4 cm
Jupiter 2.82 m
Sun 2.95 km

Objects will orbit a black hole just as they would orbit any other object with mass. If our Sun were to spontaneously become a black hole, the orbit of the planets in the solar system would be unaffected.

The closer an orbiting object is to the object it is orbiting, the faster it has to be travelling. That sentence is a bit difficult to understand, so I’ll explain it with an example: moving the Earth closer and closer to the Sun.

Distance Sun to Earth /AU Required orbital speed /km/s
1.00 29.8
0.75 34.4
0.50 42.2
0.25 59.6

Eventually we get so close to the Sun that the speed required to remain in orbit becomes equal to the speed of light. This means that only photons (which travel at the speed of light) could orbit, and in fact, would orbit. Any photons that bounced off the back of your head would travel in a circular orbit around the black hole and end up at your eyes – you’d be able to look directly at the back of your head without using mirrors!

This effect is called a photon sphere, and can definitely exist around black holes.* It is also possible that a neutron star could be so compact that a photon sphere could exist, but this has never been observed.

* Around a rotating black hole there would be two photon spheres due to frame dragging: one would be closer, with the direction of orbit being the same as the direction of rotation, and one would be further away, with the direction of orbit being opposite to the direction of rotation.

The Nuclear Double Flash

Identification of a nuclear explosion uses a number of different methods. The Comprehensive Test Ban Treaty Organisation (CTBTO) runs a series of networks which listen for infrasound sound waves produced in the atmosphere by above-ground explosions; which monitor the oceans for underwater tests; and which monitor seismic activity to detect underground tests. The CTBTO also run a network of radionuclide sensors that sample the air to detect certain isotopes produced by nuclear explosions.

But if a nuclear weapon is ever used again as a weapon of war, the first notification will come from space-based networks (e.g. the US DSP or the Russian Oko) looking for the characteristic double flash of a nuclear detonation.

 
Watch the video above of the first two seconds of the Castle Bravo nuclear test. Do you notice anything unusual? Let’s take a look at a few individual frames.

frame-27

Frame 01

frame-38

Frame 11

frame-60

Frame 49

The explosion begins bright, but then dims before becoming bright again: this is the nuclear double flash. It’s a little easier to see in the slowed-down excerpt below.

 
The variation in the brightness of the light emitted by a nuclear explosion follows a distinct pattern. It is possible to build light sources that are as powerful as nuclear explosions, or to produce light sources that have the same double flash characteristics, but not to produce a source with both characteristics. Thus the nuclear double flash is taken as irrefutable evidence that a nuclear explosion has taken place.

double-flash-graph

Note the logarithmic scale on both axes.*

As the nuclear explosion begins, the bomb and all of its components are heated to extremely high temperatures of around ten million kelvin. This causes these components to emit low-energy (“soft”) x-rays and high-energy (“hard”) ultraviolet waves. These x-rays and UV waves are absorbed by the air within a few metres of the device and this causes the air to be heated to temperatures of around one million kelvin, causing it to become incandescent and emit light. This is responsible for the initial, very fast (about three hundred millionths of a second after detonation) bright peak.

At the same time, the explosive shock wave itself (the hydrodynamic front) is expanding outwards and quickly compresses the air in front of it like a piston, causing it to become superheated. Inside this shock wave, the temperature is so high that the gas inside it become completely ionised (i.e. the gas becomes a plasma) and this makes the shock wave opaque to light. The brightness minimum is therefore caused by the shock wave “trapping” light behind it as it forms.

Light is still emitted because the shock wave itself is incandescent and is therefore emitting light outwards, ahead of itself, but this light is about one-tenth of the brightness of the preceding and following maxima. As the shock wave expands, it cools rapidly, and as it cools it becomes more transparent, allowing the light previously trapped behind it to escape. This is responsible for the second bright peak, which lasts much longer than the first because the full energy of the weapon is now being fully released, with nothing to block it. As the fireball expands it dissipates, and this is responsible for the gradual decrease in brightness.

yield-time-graph

As the graph above shows, the time of the first minimum and the time of the second maximum depend on the weapon’s yield. A larger yield means a more powerful initial release of energy, and a more powerful shock wave, and this shock wave then takes more time to “pass through” the initial hot region created by x-ray/UV absorption, and then also takes longer to cool down to the point at which is becomes transparent to the light that it has trapped behind it.

For a one kiloton device, the time between the minimum and the second maximum is only 30 milliseconds, too short a gap for the human eye to perceive, but bhangmeters aboard satellites can spot it (and by measuring the time interval get a rough idea of the weapon’s yield). For larger weapons, such as the 100 kT warheads aboard the UK’s Trident II D-5 missiles, the interval is long enough (0.3 seconds at 100 kT) for human beings to perceive.

* Taken from Guy E. Barasch, “Light Flash Produced by an Atmospheric Nuclear Explosion”, LASL-79-84, Los Alamos National Laboratory, 1979.

A More Logical System of Coinage

(Please note: I didn’t say this was necessarily a better system, just that it is more logical. I still can’t believe I spent this much time on this total non-issue.)

There are many, many currency redesigns on the internet. But everybody always concentrates on redesigning the paper currency; very rarely does someone look at redesigning the coins. I’m far from a  graphic designer, but what I can do is look at the size and shape of the coins.

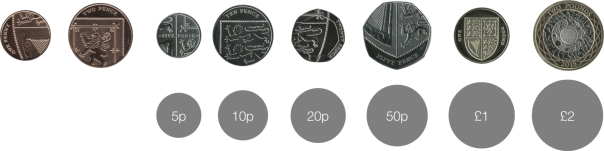
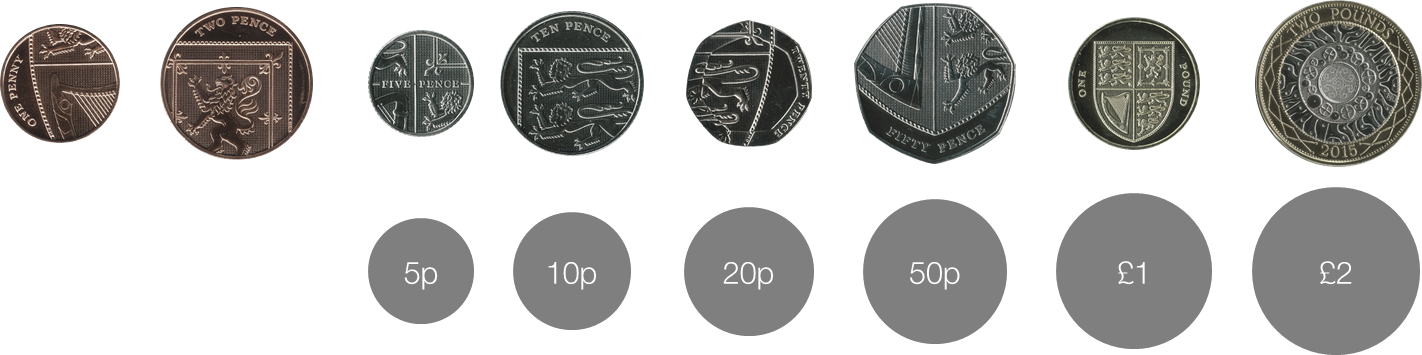
Here is what current UK coinage looks like:*

Coin Diameter /mm Thickness /mm Mass /g Material
1p 20.3 1.65 3.56 Copper-plated steel
2p 25.9 2.03 7.12 Copper-plated steel
5p 18.0 1.7 3.25 Nickel-plated steel
10p 24.5 1.85 6.5 Nickel-plated steel
20p 21.4 1.7 5.0 Cupro-nickel (84:16)
50p 27.3 1.78 8.0 Cupro-nickel (75:25)
£1 22.5 3.15 9.5 Nickel-Brass
£2 28.4 2.50 12.0 Cupro-nickel and
Nickel-Brass

Clearly this makes no sense at all. The 1p and 2p coins are both bigger than the 5p, and the 10p is bigger than the 20p. The 2p coin is heavier than the 1p, 5p, 10p and 20p coins. There are four different materials used, and even though both the 20p and 50p coins are made out of cupro-nickel, the copper-to-nickel ratio is different, which must make manufacturing them more difficult.

Step 1: Get rid of the 1p and 2p

There are a number of reasons for doing this. The 1p and 2p coins are now essentially useless for actually buying anything (which is why many countries have got rid of their 1p/2p equivalents), and the UK 2p coin is particularly big and heavy. Also, it will help when we want to scale the sizes of coins logically.

Step 2: Make coins from the same material

Since we have a fiat money system, we don’t need coins to be made out of different materials, and visual appearance isn’t important, as people will be able differentiate between our new coins using other factors. We should just use the cheapest material, which is nickel-plated steel.

Step 3: Make the sizes more logical

As demonstrated above, the sizes of UK coins currently makes no sense. We want the size of our coins to be proportional to their value, so that the £2 is larger than the £1, and the £1 is larger than the 50p and so on. (This has the useful side effect of making less “powerful” or less “useful” coins smaller and lighter, so that they take up less space in your wallet.)

However, given that we don’t want our new coins to be significantly smaller or larger, or lighter or heavier than our existing coins, we cannot vary size linearly with value. If we did this then the £2 coin would be forty times bigger than the 5p coin, and one of them would have to be either unmanageably small or unmanageably big.

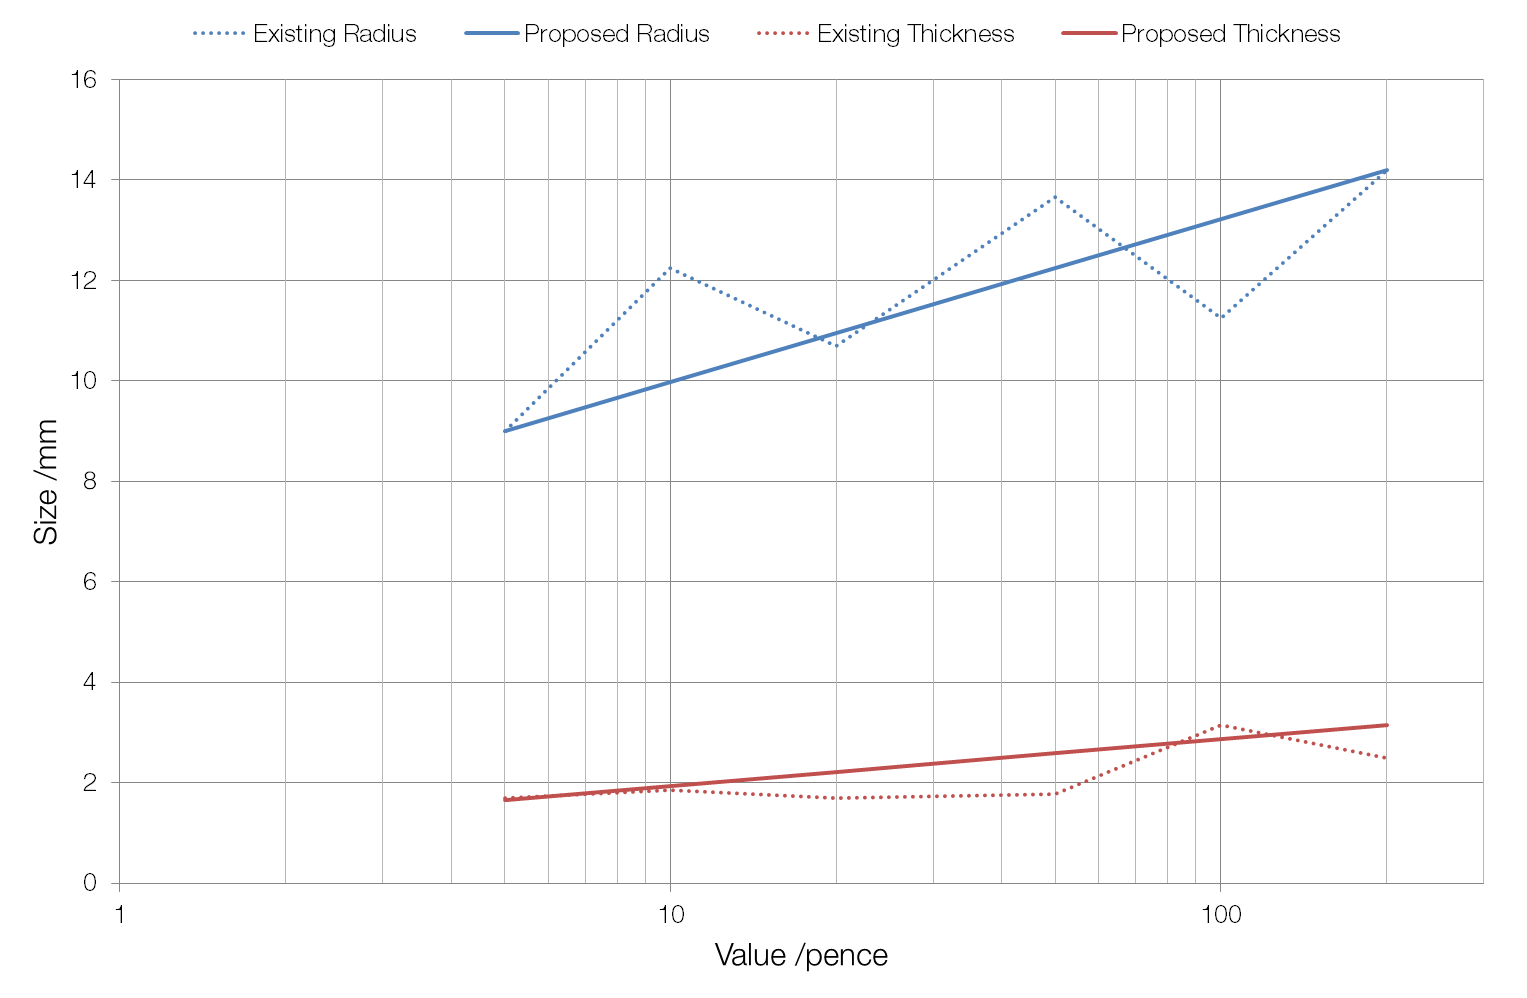
We will therefore have to use a logarithmic system to calculate the new sizes (this makes sense because people’s cognition of numbers is naturally logarithmic). Thus a £2 coin will be bigger than a £1 coin, but not twice the size; and a 50p coin will be bigger than a 10p coin, but not five times bigger.

We don’t want any coin to be smaller than the 5p (the coin with the lowest diameter) or the 1p (the coin with the lowest thickness), or to be larger than the £2 (the coin with the highest diameter) or the £1 (the coin with the highest thickness). Thus we will take the measurements of these coins to be our limits: our new coins must have diameters between 18.0 and 28.4 mm, and thicknesses between 1.65 and 3.15 mm.

After some relatively simple calculations, we end up with the following:

Coin Diameter /mm Thickness /mm Mass /g
5p 18.0 1.65 3.13
10p 20.0 1.93 4.50
20p 21.9 2.21 6.22
50p 24.5 2.59 9.08
£1 26.4 2.87 11.74
£2 28.4 3.15 14.87

new-coins-3d

Old £1 coin shown above for scale.

coin-comparisons

Most of the coins are similar in size (the 5p and £2 have exactly the same diameters), but there are a couple of notable differences.

coin-comparison-detail

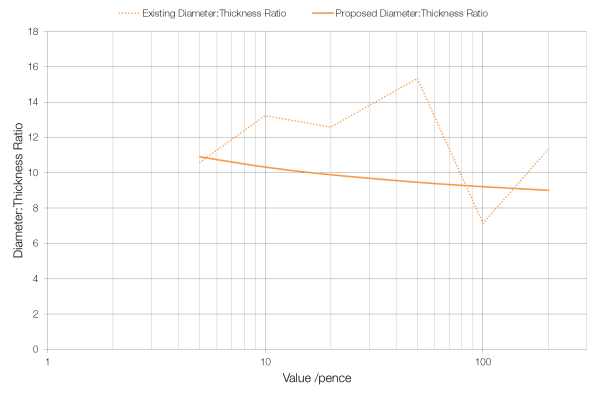
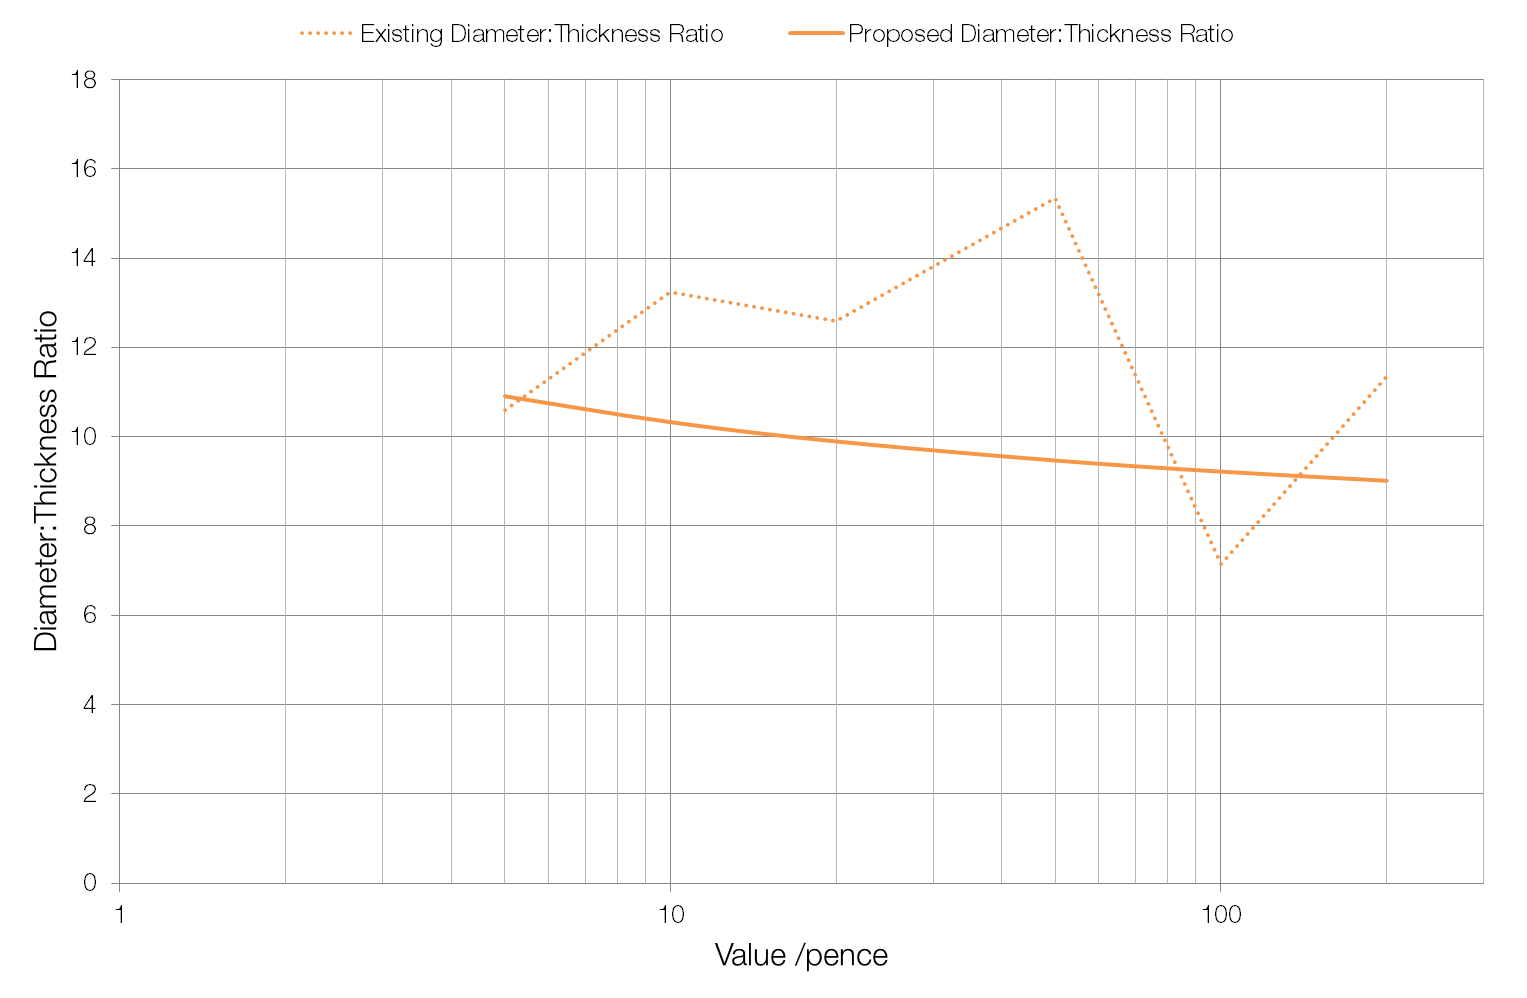
The change in properties are easier to understand via graphs.

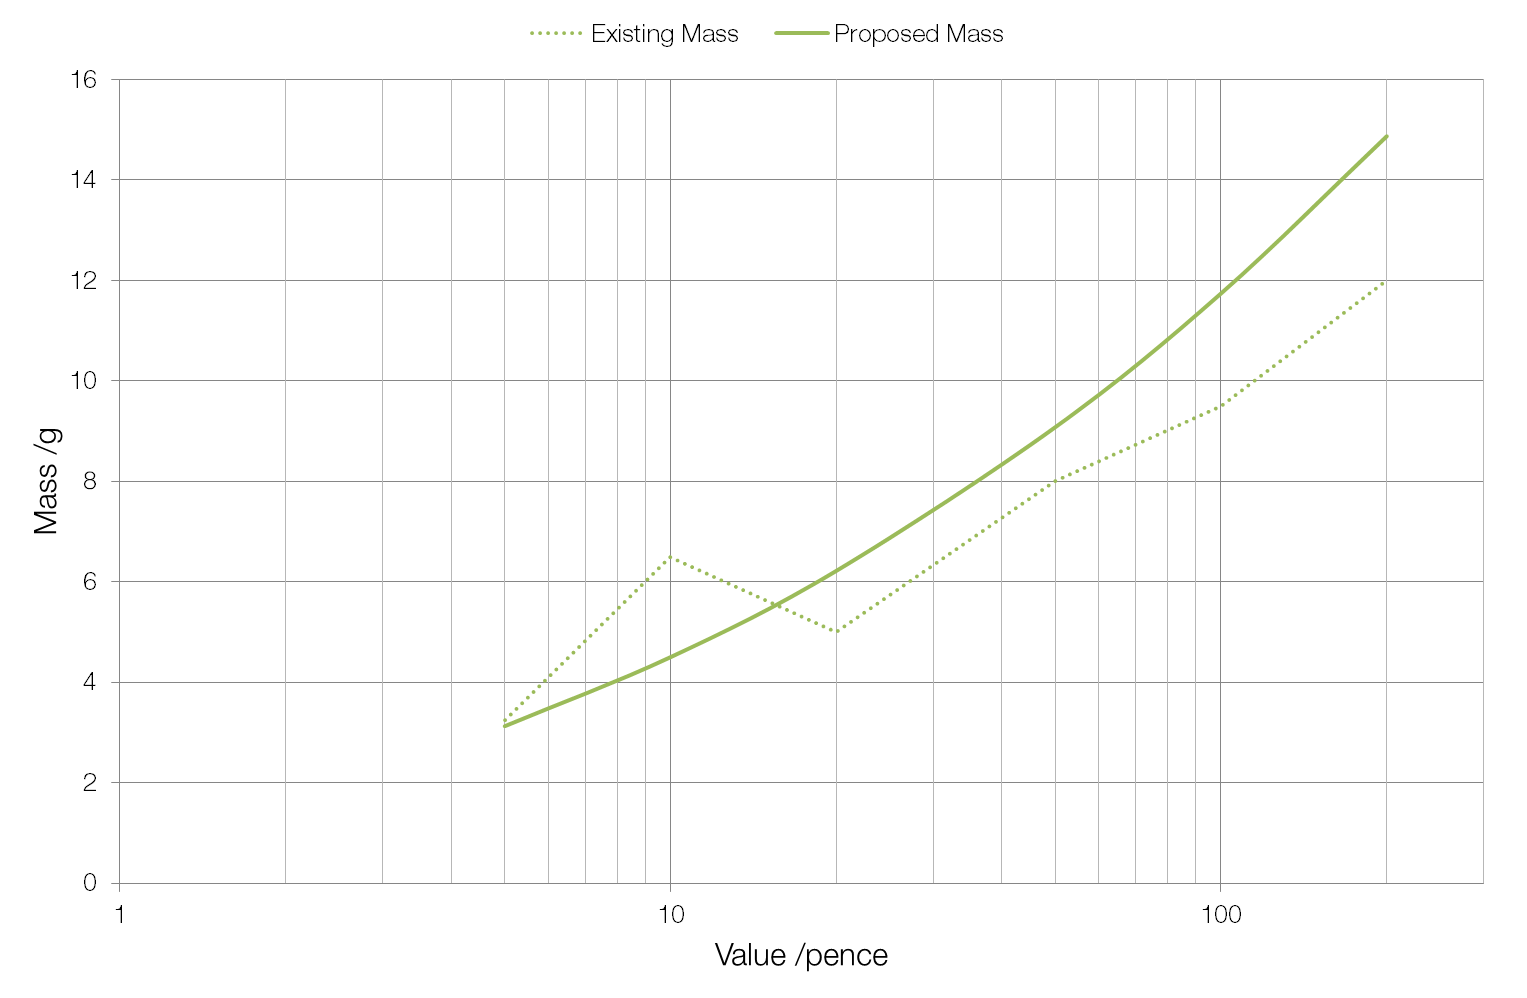
As you can see, the proposed diameter and thickness increase sensibly, whereas the existing diameters and thicknesses do not. The same is also true for the proposed masses.

proposed-coin-masses

As you can see, the proposed masses are higher than the existing masses for all but the 5p and 10p coins. However, considering the removal of the 1p and 2p coins and after running some extensive Monte Carlo testing, I can confidently say that your average pocket full of change will now weigh less. (It would not be difficult to use a less dense material than nickel-plated steel if weight proved to be a problem. We could also reduce the thicknesses of the coins, making the 2.5 mm thickness of the £2 coin our maximum.)

The logic of using a logarithmic system is further demonstrated when considering adding the £5 coin (which is really only a collectors’ item) into our system. The existing £5 coin is enormous: 39 mm in diameter and 28 grams in mass; in our new system it is a svelte 31 mm and only 19.8 grams. We could therefore replace some of our paper money, which requires frequent costly replacement, with longer-lasting coins.

Existing £1 and £2 coins shown for scale.

Known Issues

Use by the blind

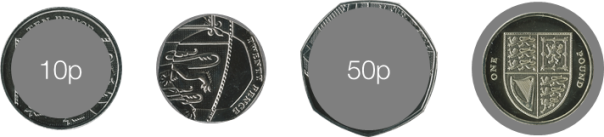
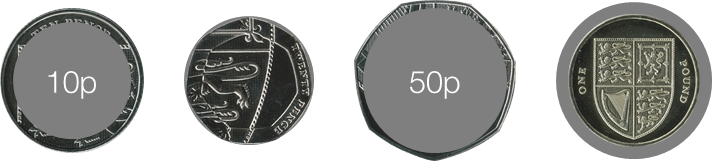
Unlike the current system, our new proposed system uses only circular coins: we do not use shapes of equal width as with the current 20p and 50p coins. This could make them more difficult for blind users to deal with.

Our new coins have a greater variation in mass than the existing coins, and this should make differentiating between them by feel easier. Also, the diameter:thickness ratio changes more noticeably (and of course, more consistently) than existing coins: coins become “fatter” relative to their diameter as their value increases.

diameter-thickness-ratio

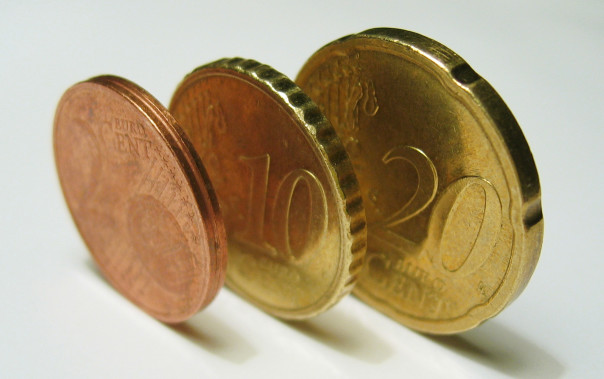
The problem of blind users is easily fixed by using different edges on our coins, as is currently done with Euro coins: the 2¢ coin has a groove around its edge, the 10¢ coin has fine “scallops” on its edge, the 20¢ coin uses a “Spanish Flower” design, the €1 coin uses interrupted milling and the €2 uses a fine-milled edge with lettering. There are more than enough different options for blind users to easily differentiate between coins.

euro-cent-edges

My choice would be for every second coin (i.e. 10p, 50p and £2) to use a scalloped edge, as the remaining coins would then different enough either by size or by feel (the scallops are easier to feel than fine milling) to differentiate between. Obviously, extensive testing with blind users would be necessary to iron-out any problems.

Other Issues

None. This is clearly a brilliant idea.

* The difference in the number of significant figures should correspond to different tolerances, but I wouldn’t be surprised if it’s a mistake by the Royal Mint.

Adjective Order in English

Adjectives in English follow a certain order. This is why “That’s a beautiful white house” sounds correct, but “That’s a white beautiful house” does not.

The order of adjectives begins with opinions: “beautiful”, “nice”, “great”, etc.

It’s a great car.

After opinions comes size: “big”, “small”, “long”, etc.

It’s a great small car.

It’s a small great car.

After opinions and size comes age: “new”, “old”, “ancient”, etc.

It’s a great small old car.

It’s an old great small car.

(Apologies for how clunky the sentences get beyond here. In English you don’t normally describe objects with quite so many objectives!)

After opinions, size and age comes shape: “rectangular”, “circular”, “boxy”, etc.

It’s a great small old curvy car.

It’s a curvy great small old car.

After opinions, size, age and shape comes colour: “red”, “blue”, “green”, etc.

It’s a great small old curvy blue car.

It’s a blue great small old curvy car.

After opinions, size, age and shape come materials: “leather”, “brick”, “wood”, etc.

It’s a great small old curvy blue metal car.

It’s a metal great small old curvy blue car.

After opinions, size, age, shape and material comes (geographical) origin: “British”, “Spanish”, “Roman”, etc.

It’s a great small old curvy blue metal British car.

It’s a British great small old curvy blue metal car.

Finally, after opinions, size, age, shape, material and origin comes purpose:

It’s a great small old curvy blue metal British racing car.

It’s a racing great small old curvy blue metal British car.

Any combination that doesn’t have the adjectives in the correct order ends up looking weird.

It’s a fantastic big new red American house.

It’s a fantastic American big new red house.

It’s a big new American red fantastic house.

It’s a red fantastic American big new house.

It’s an American new red big fantastic house.

Not all languages use an order for adjectives. For example, in Polish it doesn’t matter what order the adjectives are in: “What a wonderful small blue bag!” and “What a blue small wonderful bag!” would sound just as “correct” as each other.