Yearly Archives: 2011

Arbitrage at the speed of light

arb·it·rage n /ˈɑrbɨtrɑːʒ/
the practice of taking advantage of a price difference between two or more markets.

The image most people have of stock markets is of men (and it is always men) in suits using hand signals and shouted verbal commands to buy and sell stocks and shares; this system is called “open outcry” and in reality is used only very rarely.

The vast majority of trading now takes place via computer, and this has altered the way in which markets operate. Not only are traders using computers, but now the traders are computers, operating at very high speeds to execute pre-programmed trading strategies.

As computer hardware and software have improved it is no longer the speed at which computers operate that is most important, but rather the time taken for light to travel down the optical fibre between trading locations. Typical trading latencies are now below five hundred microseconds, enabling traders to make more than two thousand trades per second.*

Because the speed of light has become the limiting factor the physical location of trading offices is becoming more and more important. Well-positioned traders (if you’ll excuse the pun) can take advantage of the difference in price between two markets – buying low in one market and selling high in another – for a profit.

For example: imagine three traders buying and selling aluminium on the London Metals Exchange through the LMEselect electronic trading system. One trader is located in London, one in Dubai (5500km from London) and the other in Singapore (10800km from London). The speed of light in an optical fibre is about 200 million metres per second so any change in price reaches the London trader almost immediately but takes 28 milliseconds to reach Dubai and 54 milliseconds to reach Singapore. The trader in Dubai has an extra 26 milliseconds to act – enough time for more than fifty 500 microsecond trades – before the information reaches Singapore. If the trader in Dubai is trading metals in both London and Singapore then it becomes possible to buy low in London and sell high in Singapore before price information can pass between the two.

In a recent paper†, academics Alexander Wissner-Gross and Cameron Freer show that “there exist optimal locations from which to coordinate the statistical arbitrage of spacelike separated securities” and plot these locations on a map.
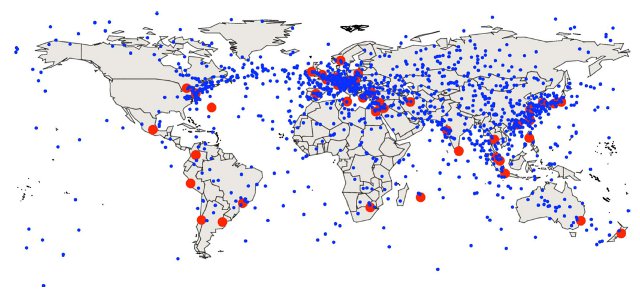

The red dots represent exchanges, the blue dots the optimal location of trading nodes between each pair of exchanges.

As the authors point out:

“[W]hile some nodes are in regions with dense fibre-optic networks, many others are in the ocean or other sparsely connected regions, perhaps ultimately motivating the deployment of low-latency trading infrastructure at such remote but well-positioned locations.”

This suggests that the location of exchanges and the speed of light may become the deciding factors as to where trading offices are sited.

* See, for example, Tara Bhupathi. 2010. “Technology’s Latest Market Manipulator? High Frequency Trading: the Strategies, Tools, Risks, and Responses”, North Carolina Journal of Law & Technology 11(2): 377-400.

† Alexander Wissner-Gross and Cameron Freer. 2010. “Relativistic Statistical Arbitrage”. Physical Review E 82(5): 056104-056110. doi:10.1103/PhysRevE.82.056104

Fuel Mix and CO2

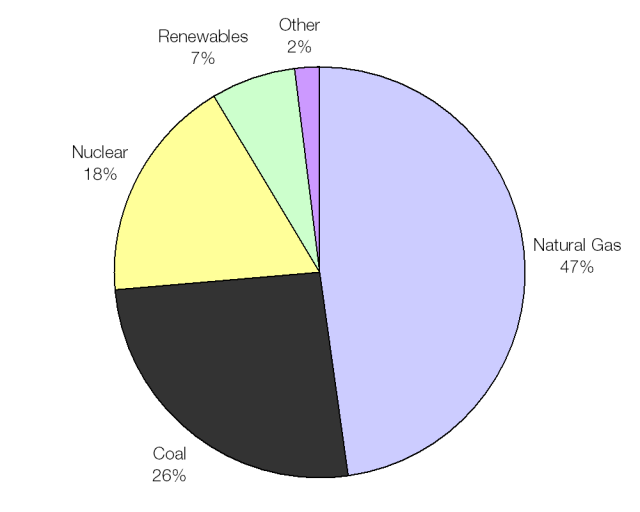
Since 2005 UK electricity suppliers have been legally obliged by Ofgem to provide information about the fuel mix they use to generate electricity and the carbon dioxide they produce in the process.

The UK average fuel mix; heavy on gas and coal.

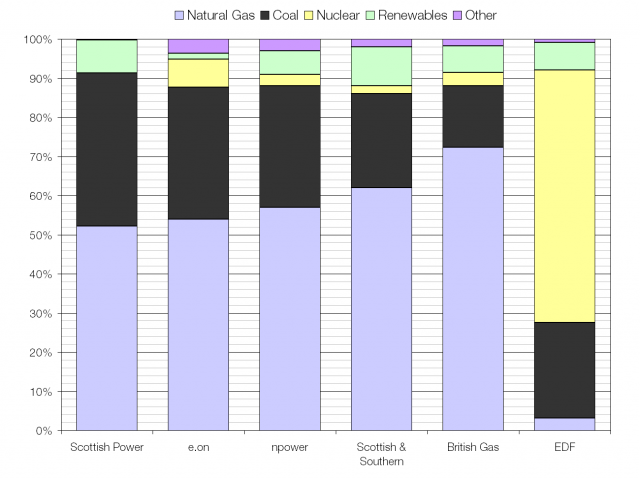
The “Big 6” energy suppliers supply 99% of the UK population between them; most have a fairly similar energy mix, but one stands out from all the rest.

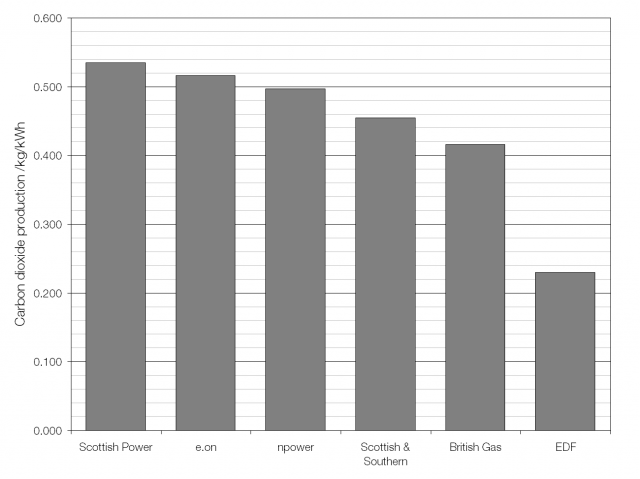
Most of the Big 6 are heavily reliant on natural gas and coal; but EDF stands out by generating more than 60% of its electricity from nuclear power. The effect that this has on the amount of CO2 that it creates for every kilowatt-hour of energy produced is very noticeable.

EDF Energy is a subsidiary of Électricité de France, so it’s no surprise to see it relying on nuclear power; France generates 78% of its electricity from nuclear power and is the world’s largest electricity exporter. This has enabled Électricité de France to become the world’s largest utility company.

Source for fuel mix data: ElectricityInfo.org

What’s the time?

(This post was prompted by Samoa’s decision to jump forward a day by moving the international date line.)

“What’s the time?” seems like a simple question, but it’s not. There are many different ways of measuring time.

Universal Time is based on the rotation of the Earth, measured using observations by the International Earth Rotation and Reference Systems Service (IERS); it replaced Greenwich Mean Time (GMT) in 1928. The IERS uses a network of stations across the globe to perform Very Long Baseline Interferometry (VLBI) of 212 distant objects (mainly quasars) outside our Milky Way galaxy. During VLBI simultaneous readings from stations a long distance apart are compared and the differences between them used to calculate the distance to, and position of these extra-galactic objects. By combining the VLBI readings with lunar ranging and GPS satellite orbit data the principal form of Universal Time, UT1 is calculated.

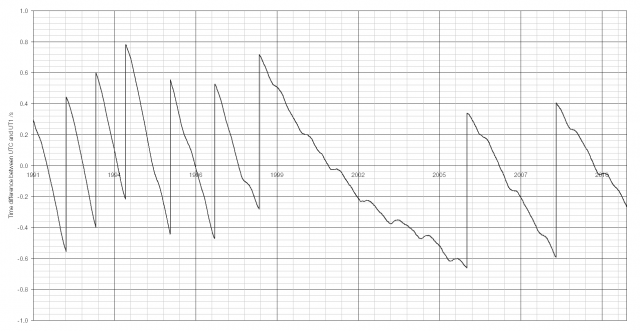
Coordinated Universal Time (UTC) is the world’s time standard; if you want to know what the current time is, you want to know what UTC is. It is based on International Atomic Time (TAI) and is always kept to within ± 0.9 seconds of UT1. If it ever falls outside of this range a leap second is introduced by IERS to correct the difference. The difference between the two arises because TAI assumes that a day is a perfect 86400 seconds long (24×60×60) whereas in reality the Earth’s rotation is irregular, overall slowing by about 1.7 milliseconds every century.*

The last ten years’ of data is shown above; a sharp vertical line indicates the introduction of a leap second. The last leap second was at the end of 2008, taking the difference between UTC and UT1 from -0.591 to +0.409 seconds. Since 1999 there have been far fewer leap seconds (two in the ten year afterwards, eight in the ten years before). The Earth’s rotational speed increased in 1999 for some unknown reason, though there may be some link with earthquakes.

TAI is the average time from more than two hundred caesium atomic clocks at about seventy laboratories across the world; every month the data from these clocks is gathered by the International Bureau of Weights and Measures Bureau (BIPM) and published to participating organisations (e.g. May’s data). TAI and UTC were synchronised in 1958 but since TAI never includes leap seconds it is gradually moving away from universal time and is currently 34 seconds ahead of UTC.

Each GPS satellite contains four caesium atomic clocks that were synchronised with UTC in 1980. Leap second corrections are never applied to GPS clocks so GPS time is now 19 seconds behind TAI, putting it 15 seconds ahead of UTC. This offset is included in the GPS time signal and receivers usually apply the correction automatically.

* The pull of the Moon increases the length of the day by 2.3 ms/century but the increase in the height of land due to the melting of glaciers decreases it by 0.6 ms/cy.