There used to be a sign outside my physics classroom:
If it’s green and wriggles, it’s biology.
If it’s green and bubbles, it’s chemistry.
If it’s green and doesn’t work, it’s physics.
This is unfortunately very true. Many classroom experiments end with me saying “what you should have seen…” or “what should have happened…”.
In this series I’m going to list experiments that actually work as intended – experiments that can be relied to end without a “should” in the explanation.
The Cooling Curve of Stearic Acid
In this experiment we’re attempting to show that the freezing process gives out energy; or alternatively that the melting process requires an input of energy. This energy is called the latent heat of fusion.
This experiment is often carried out using stearic acid (C18H36O2), which is particularly suitable as it’s fairly non-toxic and has a melting point of 69.5°C which is easily achievable with a water bath and a Bunsen burner. What pupils usually do is heat a test tube of solid stearic acid in the water bath, taking temperature readings every minute until all the stearic acid has melted.
What this data should show when plotted on a graph is a flat section where the thermal energy from the Bunsen burner is going into weakening bonds between particles rather than raising the temperature. Unfortunately, this rarely works. Pupils find it very difficult to isolate any particular section as flatter than the rest.
My version makes two important changes:
- Pupils start off with a test tube full of liquid stearic acid in a hot (80°C) water bath.
- Pupils use two thermometers: one in the stearic acid and one in the water bath, and record both temperatures at the same time.
This creates a graph that looks like this (I cheated and used a datalogger to record my data):
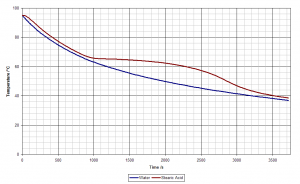
The blue line is the temperature of the water bath and the red line is the temperature of the stearic acid. At about 68°C the two lines begin to diverge. The stearic acid stays hotter than the surrounding water because thermal energy is being released by the bond-forming process as liquid turns to solid. Once all the stearic acid has become solid this release of heat ceases and the two temperatures equalise again.
This experiment requires a bit more preparation, and a little bit more work as pupils have to record two sets of temperature data, but I think it’s worth it.


