Tag Archives: experiment

Removing red wine from carpet using salt

Aim/Objective:
To prevent red wine from staining a carpet.

Hypothesis:
The hygroscopic properties of salt will cause it to draw up and remove red wine from the carpet before the red wine has time to settle in and stain.

Basis for hypothesis:
Something I overheard somewhere.

Apparatus:

  • Some waste carpet that I found in a skip
  • 2008 Wolf Blass Red Label Shiraz Cabernet Sauvignon
  • Salt
  • Measuring spoons

Method:
Two identical 1tbsp stains were created on the carpet; the first was designated the control stain. The second stain, after being left for twenty seconds to simulate the mad oh-crap-I’ve-spilt-wine-on-the-carpet dash was quenched with salt.

Observations:
Immediately after the administration of salt it was readily apparent that the salt was absorbing the red wine. After being left for one hour the “clean” salt was removed, leaving a behind pile of pink salt.

Results:

There was no apparent difference between the treated stain and the control stain, except for the treated stain being surrounded by damp salt.

Conclusion:
Whilst salt does absorb red wine, it should not be used in the prevention of red wine stains. Red wine likes carpet more than it likes salt.

Evaluation:
In future the author would advise his girlfriend of what was being attempted beforehand.

ETAW: Radioactive Dice

This is number 2 in an irregular series of Experiments That Actually Work [previously].

Using dice to simulate unstable (radioactive) nuclei is a common physics experiment. In the same way that an unstable nucleus has a chance of decaying every second, a die has a chance of decaying every throw. For example: every standard six-sided dice has a one in six (16.67%) chance of decaying each time it’s thrown and every nucleus of niobium-83 has a one in six (actually 16.91%) chance of decaying every second.

The most significant change made to the “standard” experiment is the use of novel dice. Dungeons and Dragons players use a variety of dice, from the pedestrian 4-sided tetrahedral die (d4) to the more unusual 100-sided (d100) die. We have a complete class set each of 4-sided, 8-sided, 10-sided, 12-sided and 20-sided dice. These dice aren’t particularly expensive, we bought ours in bulk from LegendGames.

The decay constant for each die is the reciprocal of the number of faces, and its mean lifetime is therefore equal to the number of faces. For example, a four-sided die has a decay constant of 0.25 roll−1 and an average lifetime of four rolls. A collection of four-sided dice has a half-life of 2.77 rolls.

The key to getting good data for this experiment is quantity. When dealing with radioactive samples you’re looking at billions of billions of atoms; so any deviations from the mean are cancelled out, but with dice that unfortunately isn’t possible. I had pupils work individually rather than in pairs and enter all their data into a big spreadsheet. One set of n dice each with s sides should take s + sloge(n) rolls to fully decay [1]; so fifty 6-sided dice should take about fifty throws, as should twenty-five 12-sided dice; there’s time enough in one lesson to collect a decent dataset.

After collecting all the data comes the important graph-plotting stage. Because we’re going to ask Excel to plot a line of best fit that’s exponential in nature, you can’t plot the last data point (dice remaining = 0). Excel won’t allow you to plot an exponential curve if one of the data points is zero.

On the graph I’ve plotted the sum of all the data runs. The most important feature of this graph is the equation of the line of best fit. This is the standard decay equation: N=N0e−λt. From the graph above we find that the decay constant is 0.0808 against an expected value of 0.0833, just over 3% less than expected.

As you collect more and more data the value of the decay constant found from the graph gets closer and closer to the correct value – I have a colleague who has a dataset encompassing many years of experiments with 6-sided dice and the value found is within 0.5% of the correct value.

[1] Because (mathematically) exponential decay never actually reaches zero, I’ve calculated this as the number of throws taken to get down to one die remaining, and added the mean lifetime of that die.

Experiments That Actually Work: Latent heat of fusion

There used to be a sign outside my physics classroom:

If it’s green and wriggles, it’s biology.
If it’s green and bubbles, it’s chemistry.
If it’s green and doesn’t work, it’s physics.

This is unfortunately very true. Many classroom experiments end with me saying “what you should have seen…” or “what should have happened…”.

In this series I’m going to list experiments that actually work as intended – experiments that can be relied to end without a “should” in the explanation.

The Cooling Curve of Stearic Acid

In this experiment we’re attempting to show that the freezing process gives out energy; or alternatively that the melting process requires an input of energy. This energy is called the latent heat of fusion.

This experiment is often carried out using stearic acid (C18H36O2), which is particularly suitable as it’s fairly non-toxic and has a melting point of 69.5°C which is easily achievable with a water bath and a Bunsen burner. What pupils usually do is heat a test tube of solid stearic acid in the water bath, taking temperature readings every minute until all the stearic acid has melted.

What this data should show when plotted on a graph is a flat section where the thermal energy from the Bunsen burner is going into weakening bonds between particles rather than raising the temperature. Unfortunately, this rarely works. Pupils find it very difficult to isolate any particular section as flatter than the rest.

My version makes two important changes:

  1. Pupils start off with a test tube full of liquid stearic acid in a hot (80°C) water bath.
  2. Pupils use two thermometers: one in the stearic acid and one in the water bath, and record both temperatures at the  same time.

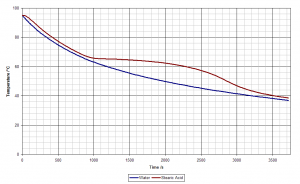
This creates a graph that looks like this (I cheated and used a datalogger to record my data):

cooling-curve-stearic-acid

The blue line is the temperature of the water bath and the red line is the temperature of the stearic acid. At about 68°C the two lines begin to diverge. The stearic acid stays hotter than the surrounding water because thermal energy is being released by the bond-forming process as liquid turns to solid. Once all the stearic acid has become solid this release of heat ceases and the two temperatures equalise again.

This experiment requires a bit more preparation, and a little bit more work as pupils have to record two sets of temperature data, but I think it’s worth it.