Tag Archives: radon

The most radioactive parts of the UK

The average radioactive background dose in the UK is 2.7 millisieverts. Of this 2.7 mSv, 1.35 mSv comes from radioactive radon gas leaking out of the ground.

This radioactive radon (Rn-222) is produced by the decay of uranium-238, after a series of intermediate non-gas stages that cannot escape from rocks.

Because radon has such a large effect on the annual radiation dose that someone receives, it is closely monitored. In the UK, this monitoring is done by the Health Protection Agency (HPA). One of the things that the HPA does it produce radon maps, showing which areas of the UK have the highest presence of radon.
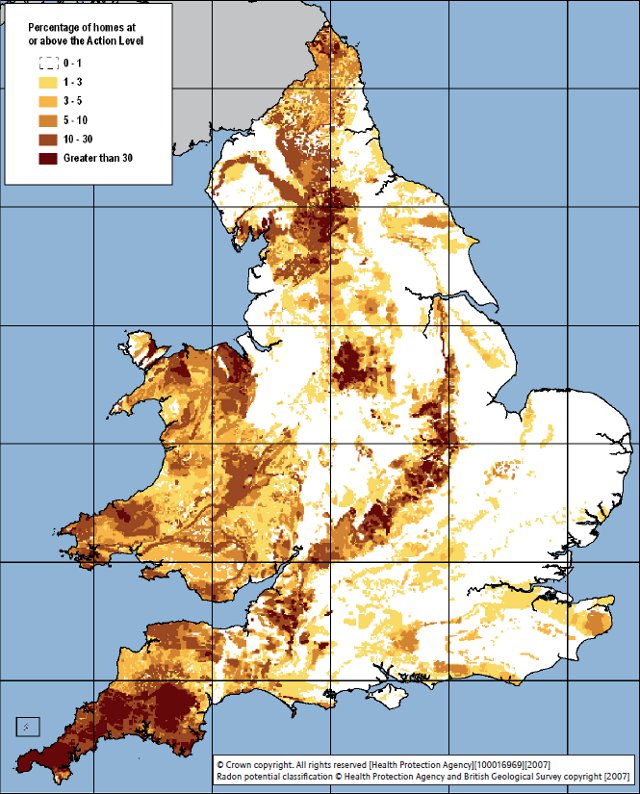
The map is graded by the percentage of homes in that area which have a level of radon beyond the action level of 200 becquerels per cubic metre (200 radon decays per second per cubic metre).

There are a number of important radon hotspots in the UK. The most noticeable one is Cornwall in the south-west where the average UK background dose is 7.8 mSv, nearly three times the national average. This is due to the presence of igneous granite, which naturally contains more uranium (10-20 parts per million) than other rocks.

Radioactive areas tend to be hilly, where igneous rocks have been forced to the surface or left behind by the erosion of softer sedimentary rocks (the Chiltern Hills are particularly radioactive, for example). The Yorkshire Dales sit on top of an underground deposit of pink granite called the Wensleydale Granite that lies underneath the Askrigg Block, and the Peak District features many granite outcroppings.
Japan’s atmosphere heated before earthquake struck

For a long time there have been reports of “earthquake lights”, aurora-like lights or colours that appear in the sky during, or just before, earthquakes. Their existence is not widely accepted, but a group of US and Russian researchers claim to have discovered a different earthquake-related atmospheric effect.

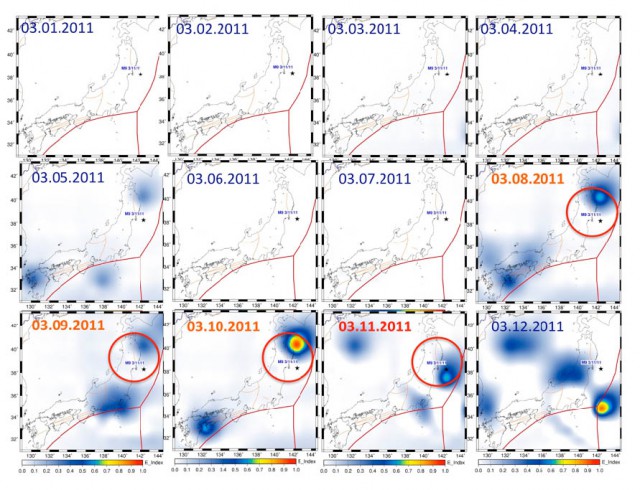
After the March 11 quake in Japan the researchers looked at atmospheric data from the days before the quake struck, and their data appears to show a noticeable heating effect in the atmosphere beginning three days before the quake.*

Red lines indicate tectonic fault lines and the star indicates the location of the March 11 earthquake.

The article claims that this heating is due to a complex mechanism called the lithosphere-atmosphere-ionosphere coupling mechanism, in which the lithosphere (the rocky crust of the Earth), the atmosphere (the layers of gas surrounding the Earth) and the ionosphere (a layer of the atmosphere that contains particles that have been ionised by the Sun, where aurora occur) interact with each other.

They posit that small movements of the crust that occurred before the earthquake released radioactive radon gas (created by the radioactive decay of uranium and thorium in the crust) that was trapped there. This radon gas (either Rn-220 or Rn-222) is a highly-ionising alpha emitter. The researchers propose that the radon creates ionised particles in the air that cause water molecules to condense out of their vapour state. This condensation process releases energy, causing the surrounding atmosphere to increase in temperature.

Dimitar Ouzounov et al. 2011. “Atmosphere-Ionosphere Response to the M9 Tohoku Earthquake Revealed by Joined Satellite and Ground Observations. Preliminary results” arXiv:geo-ph/1105.2841v1

* Not everyone agrees with their data.