The composition of nuclear electromagnetic pulses

When a nuclear weapon is detonated at high altitude the effects are very different to those created by a low-altitude detonation. Aside from creating a much larger, much faster-expanding fireball, the nuclear detonation also creates an electromagnetic pulse (EMP) that can damage electromagnetic equipment on the ground.

A nuclear EMP differs from other EMPs such as those generated by lightning strikes or by conventional EMP weapons (such as flux compression generators) in that it is much more powerful* and is composed of three different pulses called E1, E2 and E3.

E1

The E1 pulse is the most destructive, occurring far too quickly for protective equipment to activate. It is the component that destroys computers and communications lines by causing the insulating components of these devices to become conducting and allowing electrical current to flow between regions that are not supposed to be connected, effectively short-circuiting all circuits simultaneously.

The E1 pulse is created when the intense gamma radiation from the nuclear detonation ionises atoms in the upper atmosphere (Compton scattering); releasing electrons which travel downward at relativistic speeds, about 95% of the speed of light. Any charged particle in a magnetic field will experience a force (the motor effect) and the Earth’s magnetic field causes the electrons liberated by the gamma radiation to follow a spiral path around the magnetic field lines. As the electron oscillates back and forth it creates an electromagnetic field and as there are about 1025 electrons doing this simultaneously, this creates a very powerful (about 50000 volts per metre, 6.6 megawatts per square metre) but very short-lived electromagnetic pulse. The E1 pulse typically reaches its peak value in about five billionths of a second (five nanoseconds) and ends after about one millionth of a second (one microsecond) as the scattered electrons are stopped by collisions with air molecules.

The shape of the region affected by the E1 pulse depends on latitude, due to the changing orientation of the Earth’s magnetic field. Away from the equator the region is U-shaped, and towards the equator it is more symmetrical.

E2

The E2 component is caused, like E1, by Compton scattering when scattered gamma rays, gamma rays produced by interaction of fission neutrons with atoms in the air and gamma rays produced by radioactive decay of fission fragments ionise air particles.

The E2 component lasts from about one microsecond after detonation to one second after detonation and is very similar to the pulses created by lightning strikes. The E2 component is easy to protect against using conventional lightning protection equipment, but this protective equipment is likely to have been damaged by the E1 component and will therefore not function correctly, allowing the E2 component to cause further widespread damage.

E3

The E3 component is very different to the E1 and E2 components. It lasts tens to hundreds of seconds and is caused when the Earth’s magnetic field “snaps” back into place after being pushed out of the way by the ionised plasma created by the expanding nuclear fireball. This induces electrical currents in conductors on the ground such as pipelines, power lines and transformers.

The E3 component is similar to the pulse created by a geomagnetic storm, when a severe (X-class) solar flare pushes on the Earth’s magnetosphere and is sometimes referred to as “Solar EMP”. In 1989 a solar EMP-type event caused the collapse of the Hydro-Québec power grid when a huge coronal mass ejection followed a X15-class solar flare.

* During a Soviet nuclear EMP test called K-3 the E3 component of the pulse fused the entire length of a 570-kilometre overhead telephone line (with currents reaching up to 3400 amperes) and the E1 component caused all of the attached overvoltage protectors to fire. The test also started a fire that caused the Karaganda power station to burn down and penetrated nearly a metre into the Earth to burn out 1000 km of buried power cables.

Hypnic jerk

Have you ever been lying in bed, trying to get to sleep, and suddenly felt like you were falling? If you have, then you’ve experienced a hypnic jerk.

A hypnic jerk is a positive myoclonic twitch that occurs during hypnagogia, the state between being awake and being asleep. Myoclonus is a sudden, involuntary muscle twitch and a positive myoclonic twitch is one that causes a muscle, or a group of muscles, to suddenly contract.* A hiccup is a myoclonic twitch affecting the diaphragm.

The exact cause of hypnic jerks is unknown, though I have heard it suggested that it is linked to human beings’ origins as tree-dwelling primates, or that it is a defence mechanism designed to jerk you back into consciousness if the body thinks it is “shutting down” too quickly as you fall asleep.

* A negative myoclonic twitch causes a muscle or muscle group to relax.

Critical mass and fizzles

In nuclear weapon design a critical mass is the minimum amount of nuclear material required to sustain the chain reaction necessary for a nuclear explosion.

There are a number of factors that affect the critical mass.

  • Material, enrichment and purity: Different nuclear materials have different properties (most importantly fission cross-section). To make a nuclear weapon far less plutonium-239 is required than uranium-235, because Pu-239 has a much larger fission cross-section.
  • Shape: As neutrons escape through the mass’s surface, and collide throughout the mass’s volume, it is desirable to keep the surface area to volume ratio as low as possible: a sphere is therefore the appropriate choice.
  • Density: If the density of a mass is increased then the nuclei are forced closer together and the critical mass required decreases. Modern nuclear weapons use explosive lenses to compress a sub-critical mass of plutonium into a super-critical state.
  • Temperature: The likelihood of fission depends on the relative velocity of the fission neutrons and the nuclei of the nuclear fuel. If the temperature of the mass is decreased, fission becomes more likely.
  • Reflectors and tampers: A neutron reflector placed around the critical mass prevents neutrons from escaping and reflects them back into the mass, decreasing the critical mass required. A tamper prevents the critical mass from expanding and keeps it concentrated in a small volume, also decreasing the critical mass. In many bomb designs the reflector and tamper are the same structure.

Changing any one of these factors could allow a material to go from sub-critical to critical. For example, a rod-shaped mass suddenly compressed into a sphere could become critical, as could a warm mass that is suddenly cooled.

The graph below shows the importance of choosing a nuclear material. Many isotopes require a smaller critical mass than uranium-235 or plutonium-239 but these are unsuitable for various reasons connected to the factors listed above. For example, isotopes of californium are too radioactive, neptunium-236 is too difficult to separate from its parent isotopes and plutonium-238 releases too much heat due to alpha-decay.

critical-mass-graph

A fizzle occurs when a bomb creates a critical mass too slowly and nuclear predetonation occurs, destroying the bomb before the fission chain reaction can propagate throughout it. The first North Korean nuclear test in 2006 was a fizzle, with a yield of less than one kiloton, twenty times smaller than any other country’s initial test.

fizzle

In the diagram above two sub-critical masses are brought together too slowly, causing a predetonation that throws the two masses away from each other, causing a fizzle and preventing a nuclear explosion.

Turboencabulator

Scientists at General Electric are now close to perfecting a machine that would not only supply inverse reactive current for use in unilateral phase detractors, but would also be capable of automatically synchronising cardinal grammeters. This machine has come to be known as a “Turboencabulator” but is also sometimes referred to as a “retro-turboencabulator”, depending on the configuration of the phase detractors.

Extract of original GE turboencabulator patent filing

The prototype of the machine has a base-plate of prefabulated amulite, surmounted by a malleable logarithmic casing in such a way that the two spurving bearings are in a direct line with the pentametric fan. The main winding is of the normal lotus-δ type, which is placed in panendermic semi- or full-boloid slots in the stator, with every seventh conductor being connected by a nonreversible treme pipe to the differential on the ‘up’ end of the grammeters.

GE’s original prototype turboencabulator

Twenty-one or forty-two manestically spaced grouting brushes are arranged to feed into the rotor slipstream a mixture of high S-value phenylhydrobenzamine and 5% reminative tetryliodohexamine. Both of these liquids have specific pericosities given by P = 2.5 C.n where n is the diathetical evolute of retrograde temperature phase disposition and C is the annular grillage coefficient. Initially, n was measured with the aid of a metapolar refractive pilfrometer, but recent advantages have used hopper dadoscopes. The turboencabulator has already been successfully used for operating nofer trunnions. In addition, whenever a barescent skor motion is required, the turboencabulator may be employed in conjunction with a in-drawn reciprocating arm to reduce sinusoidal depleneration.

More information:

The mean centre of world lighting

The amount of light emitted by a civilisation is closely correlated with the level of development of that civilisation. If one compares North and South Korea at night this becomes very obvious – almost the only city lit up in the DPRK is the capital Pyongyang.

korea

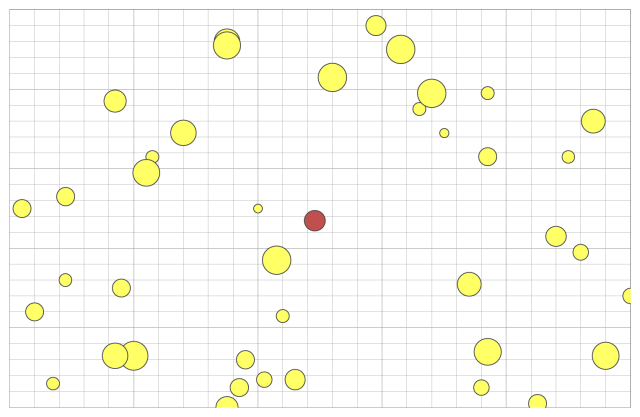
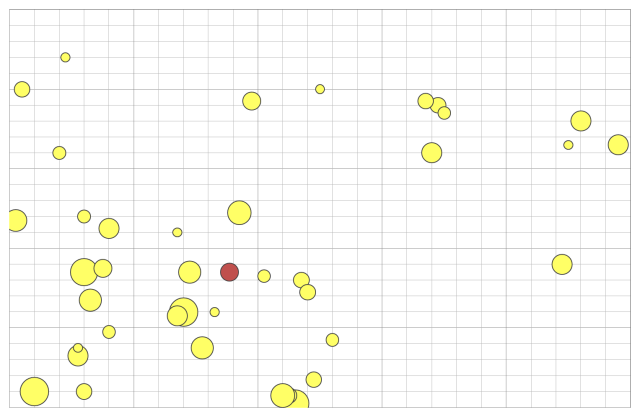
A new paper* looks at the “mean centre of world lighting”, a weighted average of all the lighting on Earth. In the example maps below the mean centre of lighting is indicated in red.

random-weighted-averageAn example of a truly randomly distributed map.

weighted-weighted-averageAn example map in which there are more and brighter lights in the “south west” quadrant of the map.

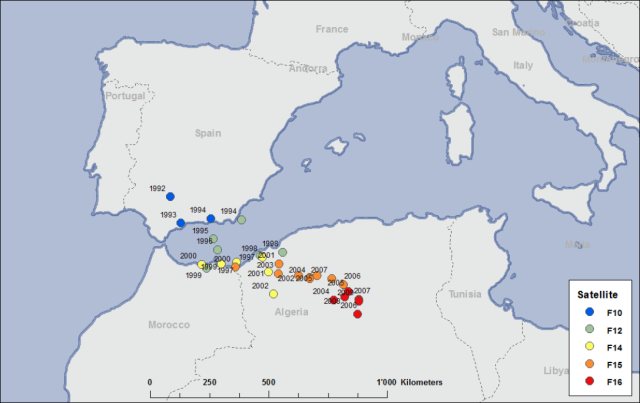
The researchers behind the paper find that the mean centre of world lighting is moving eastwards at about sixty kilometres per year.

centre-world-lighting

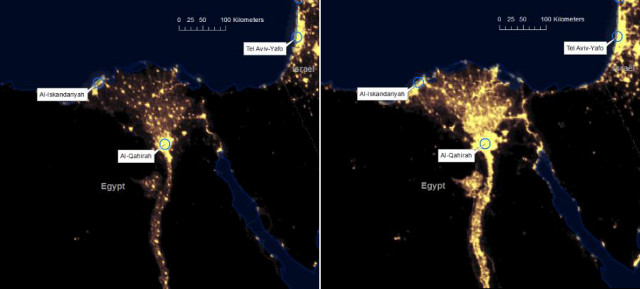
The movement of the mean centre of world lighting is primarily due to increased development in countries like India and China and the movement of rural populations to urban centres. As an example, the image below (taken from the paper) shows increased development in the Nile Delta region between 1992 and 2009.

development-nile-delta

* Nicola Pestalozzi, Peter Cauwels and Didier Sornette, “Dynamics and Spatial Distribution of Global Nighttime Lights”, arXiv: 1303.2901.