In researching a post about the Kármán Line I discovered the NASA MSIE E-90 atmosphere model (thanks to Rhett Allain) which models the composition of Earth’s atmosphere up to an elevation of 1000 km. I found it very interesting.
Up to around 100 km the composition is fairly “normal”, in that it’s what we surface-dwellers would expect: mostly molecular nitrogen (N2 rather than N) and molecular oxygen (O2) with a small amount (0.93%) of argon and traces of some other gases (carbon dioxide, neon, etc.).
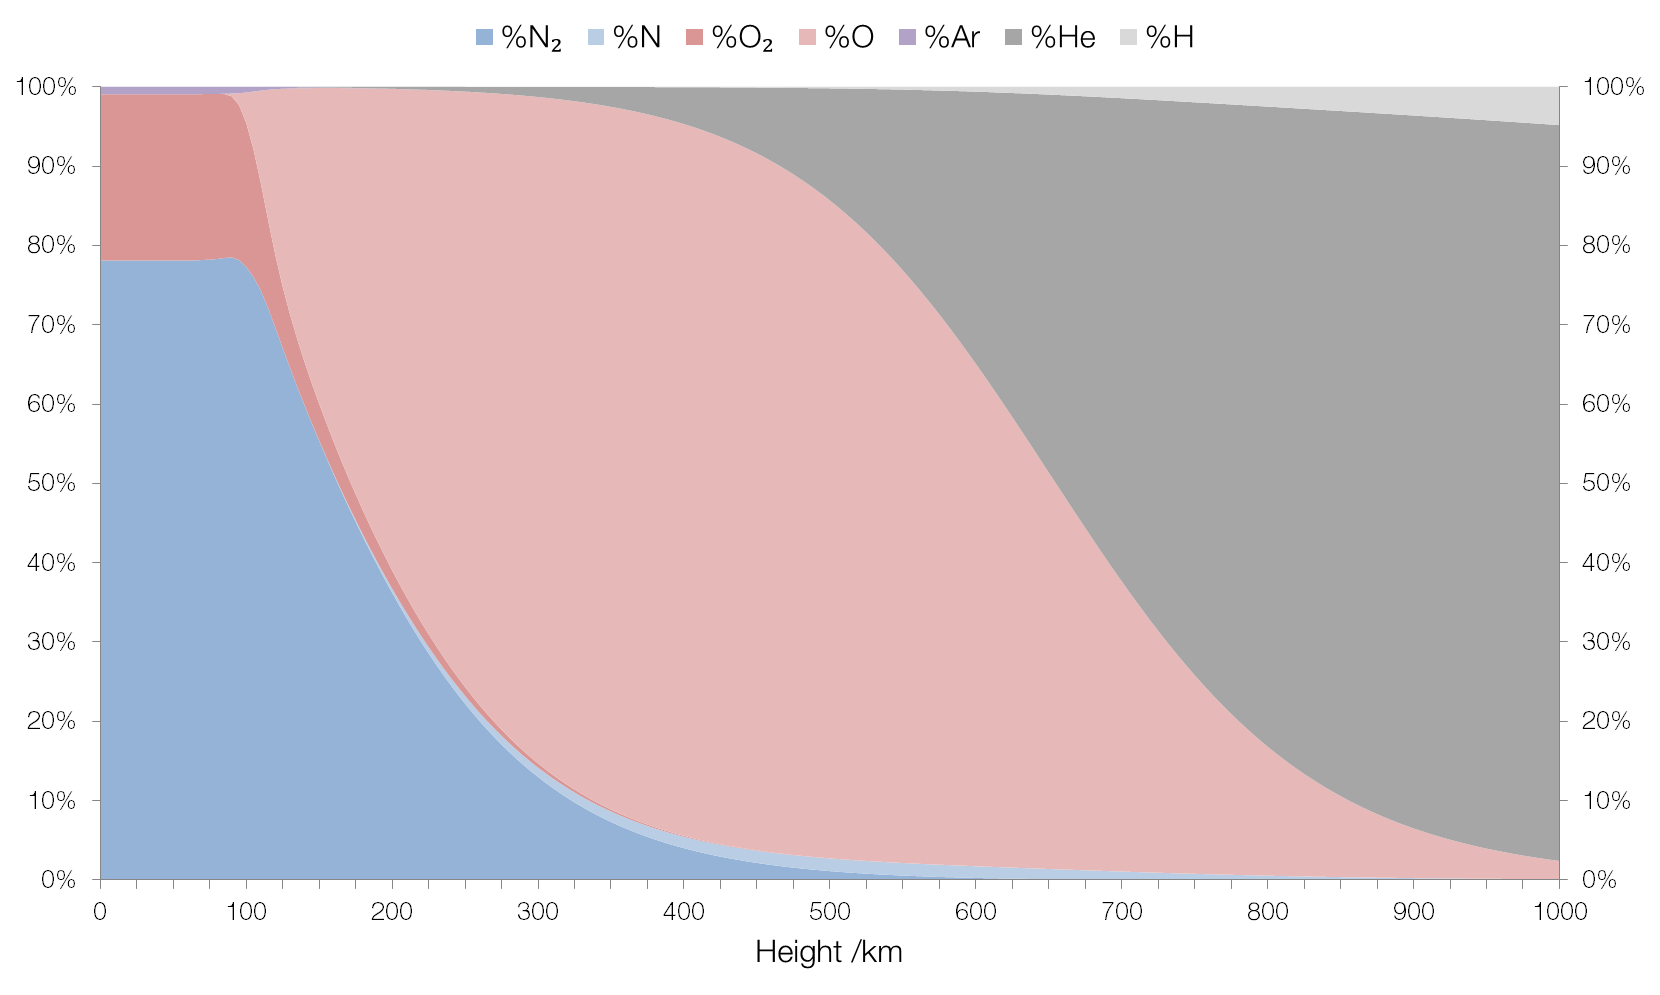
After 100 km the percentage of molecular nitrogen and molecular oxygen decrease sharply, and there is a similarly sharp increase in monatomic and triatomic oxygen, better known as ozone (i.e. this represents the “ozone layer”). There is also a small increase in the percentage of monatomic nitrogen and nitrogen compounds, and argon disappears entirely.
By 200 km ozone dominates, and this continues to about 650 km where helium takes over as the predominant component. Monatomic nitrogen and nitrogen compound concentration peaks at around 500 km, with an overall concentration of 1.6%.
By the time we reach an elevation of 1000 km helium makes up 93% of the atmosphere. This is due to the fact that helium is an unreactive and very light atom (with a mass about one-eighth of oxygen) and thus isn’t held tightly by Earth’s gravitational field. (Helium is so light that it can escape Earth’s gravity entirely.) The bulk of the remainder is hydrogen, also prevalent due to its low mass (about one-sixteenth of oxygen’s).

The concentration of “normal” gases in the atmosphere with elevation.
The concentration of less common gases in the atmosphere with elevation.
It’s important to note that the graphs above all show concentration as a percentage of the total number of particles of gas in the atmosphere, rather than by mass or volume. The atmosphere becomes incredibly thin at high elevations, so that particles of gas may travel many kilometres between collisions, and if absolute concentrations were used instead, the graph would look very different (and be completely unusable, which is why I haven’t included it here).