Monthly Archives: March 2010
A man’s got to have a code …

Kinetic hydropower
Wind is moving around the world all the time, and we use that for generating electricity. But water is moving around the world all the time too – can’t we use that to generate electricity?

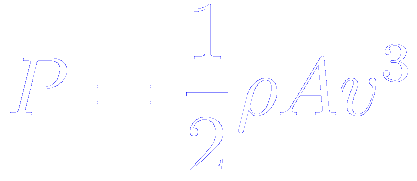
A wind turbine is a device that converts kinetic energy (of the wind) into electrical energy. If you solve all the right equations you find out that the power (P) of a wind turbine is the product of the density of the air travelling through it (ρ), the cross-sectional area of the blades (A) and the speed of the wind cubed (v). (This means that if you double the speed of the wind, the power produced goes up by a factor of eight; if you triple it the power goes up by a factor of 27.)
This equation applies to any situation in which we’re using a fan-type arrangement to “catch” a moving fluid and extract useful electrical energy from its kinetic energy, so it applies just as well to moving water as it does to moving air.

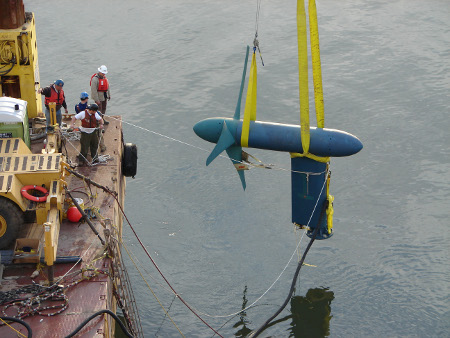
Kinetic hydropower is the fancy name for putting a wind turbine underwater. Although the water in a river or sea moves much slower than the wind, the fact that it is much denser (about a thousand times denser) means that it can still generate reasonable amounts of electrical power. The low rotational speed also helps to protect marine life, which isn’t the case for wind turbines and birds.
Kinetic hydropower systems are expensive and difficult to install, and have to very sturdy to withstand the larger forces that moving water imparts; but if the engineering challenges can be overcome they have significant advantages over wind turbines, particularly in respect of their intermittency – a river’s flow is far more reliable than wind’s.
The dangers of extrapolation
Physics isn’t for everyone; every year there’s a pretty good chance that at least one person will drop out of a group (sometimes you get drop ins too). This year one group in particular has lost more pupils than average so I decided to start collecting data.

I plotted the data and added a line of best fit.
The R2 value is 0.934 so there’s fairly good correlation in the dataset. Now that I have an equation linking the date (x) and the number of pupils in the class (y) I can work out when the next pupil will leave the group by setting y to equal seven.
y = −0.0165x + 671.63
7 = −0.0165x + 671.63
x = 40280.61
Excel handles dates in a strange way, so the figure of 40280.61 needs to be converted into a regular date: now I know that the next pupil will leave 6PH3 on the 12th April 2010 (at half past two).
I can even find out when the class will be empty by solving for y=0.
0 = −0.0165x + 671.63
x = 40704.84
The class will finally empty out at 10th June 2011 at twenty past eight.
I thought that perhaps the linear fit wasn’t the best approach so I tried a polynomial fit, which turned out to have an R2 value of exactly 1.
It turns out that this line only has one real solution, and according to that, I won’t run out of pupils until 27th June 2103.


