Tag Archives: analysis

n-grams and the most popular science

I’ve heard it said that:

The 19th Century was the century of chemistry,
The 20th Century was the century of physics,
The 21st Century will be the century of biology.

And that’s probably accurate*.

Google’s Labs division has released a new product, the Books Ngram Viewer (an n-gram is a string of characters where n represents the number of characters). Google’s n-gram viewer is based on the enormous corpus created by the Google Books program that has digitised more than fifteen million books.

It’s quite interesting to look at the appearances of the sciences in the record; it seems to confirm the aphorism above.

“Natural philosophy” dominates until the 1850s when “physics” becomes the more common term. “Chemistry” clearly dominates over “physics” until the 1920s at which point there are a number of exchanges until the late 1950s after which point “physics” is the dominant term. You can also see “biology” overtaking “chemistry” in the 1990s.

* This is only because physicists have switched their attentions to areas of biology like bioinformatics and computational biology.

Postcode fun

I downloaded the longitude and latitude of all the UK postcodes from Free Map Tools and imported them into Excel. Inspired by dy/dan’s excellent “What Can You Do With This?” segment I started playing around with the data.

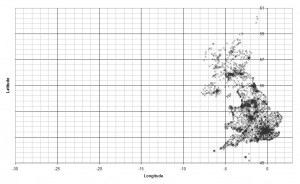
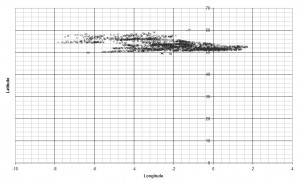
When I first plotted the data they didn’t look like much:

postcodes-version1

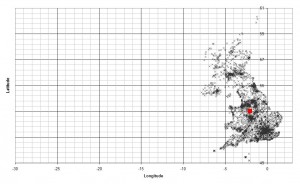
But with the scale adjusted a picture starts to form:

postcodes-version2

The red marker in the “map” below shows the mean average of the postcodes.

postcodes-version3

Because postcodes have to cluster around centres of population the mean marker shows the UK’s approximate centre of population; the clustering is clearly visible around major cities such as London, Birmingham, Glasgow and Liverpool.

The clustering effect also explains why Scotland, Wales and Northern Ireland, with population densities of  65, 141 and 125 people per square kilometre respectively, are much less well-defined than England which has an average density of 380 people per square kilometre [source].

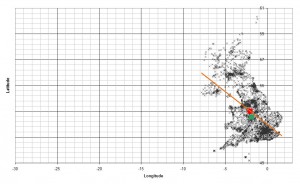
For fun, I also added a line-of-best-fit and the median point. I’m not sure they really mean anything but, hey, I was on a roll.

postcodes-version4