Yearly Archives: 2011

SNIFing out rogue nuclear reactors

This was my losing entry for the Wellcome Trust Science Writing Prize.

The search for hidden nuclear reactors has traditionally been an intelligence operation run by organisations like the CIA and the SIS (formerly MI6), but in future it might the initials of France’s Atomic Energy Commission (CEA) that become ubiquitous in the fight against nuclear proliferation. In a paper1 accepted for publication in the prestigious journal of nuclear physics Physical Review C, Thierry Lasserre and colleagues from the CEA outline a radical new method for detecting clandestine or rogue nuclear reactors – the IAEA diplomatically calls them “undeclared reactors” – using mobile neutrino detectors transported by supertankers. Lasserre’s group calls the project SNIF: the Secret Neutrino Interactions Finder.

When uranium and plutonium nuclei split (when they “fission”) they produce smaller lighter nuclei called fission fragments. It is these fission fragments that make up radioactive waste and have names like strontium-90. These fission fragments are always heavy in neutrons: iodine-131 and caesium-137, two isotopes that have been in the news recently because of the accident at the Fukushima Daiichi nuclear plant both contain four more neutrons than their stable forms. These unstable neutron-heavy isotopes always become stable by undergoing beta decay, one of the three main types of radioactive decay.

During beta decay a neutron inside the nucleus turns into a proton and in the process releases an electron and an electron antineutrino. For every watt of thermal energy produced in the reactor about a thousand billion electron antineutrinos are produced. As a typical clandestine reactor will have a power of between ten million and two billion watts this equates to a very large release of neutrinos.

Neutrinos are tiny neutrally-charged particles with almost no mass. Because they are so small, and because they have no charge, neutrinos have almost no interactions with matter at all. Right now, no matter where in the world you are, there are millions of neutrinos emitted by the Sun travelling through your body at close to the speed of light.

The fact that neutrinos don’t interact means that it is impossible to prevent them from leaving the reactor. Burying your reactor a mile underground or encasing it in steel and concrete won’t work – these are effectively transparent to neutrinos. The fact that neutrinos don’t interact with matter also makes them very difficult to detect: neutrino detectors have to be very large to have a reasonable chance of capturing a neutrino “event” in a reasonable amount of time. The Super-Kamiokande neutrino detector in Japan contains fifty million kilograms of ultra-pure water in a cylinder 39 m across and 41 m tall and only detects about fifteen events per day.

The French group’s work expands on previous work2 by Eugene Guillian at the University of Hawaii which proposed an array of stationary one megaton detectors by suggesting a flotilla of supertanker-borne mobile detectors. Their paper suggests a cylindrical detector 46 m across and 97 m long, submerged one and a half kilometres underwater to reduce interference from “background” neutrinos present due to solar activity and natural radioactive decay.

The SNIF detector would be filled with a chemical called linear alkylbenzene – normally used in the preparation of detergents – and be “doped” with the element gadolinium to increase the detection rate. The inside of the cylinder containing the alkylbenzene would be covered by thousands of photomultiplier tubes (PMTs), ultra-sensitive light sensors designed to pick up the flashes of ultraviolet light created on the very rare occasions when a proton in the detector “absorbs” the electron antineutrino. The Super-Kamiokande detector uses a little over 13000 of these PMTs, 6600 of which were shattered in a chain reaction in late 2001 and each of which had to be replaced by hand at a cost of three thousand dollars each.

By combining readings from their detector with the location and power of known nuclear reactors and a map of naturally-occurring “geoneutrinos”3; and by using a bit of common sense – reactors are usually located near oceans or rivers for cooling, for example – Lasserre and his colleagues suggest that they could locate a three hundred megawatt research reactor producing fuel for a nuclear weapon to within “a few tens of kilometres” after only sixth months’ observation from three hundred kilometres away. If the number of detectors or the observing time is increased then even tiny research reactors could be accurately located.

Tyrannical despots need not start worrying immediately. The SNIF detector would be three times the size of the largest detectors existing today and would present significant logistical and operational difficulties. Nevertheless, as Lasserre points out, the possibility of non-civilian use of nuclear reactors is a growing one, and may eventually justify the creation of a real-life SNIF project.

1 Thierry Lasserre et al. 2010. “SNIF: A Futuristic Neutrino Probe for Undeclared Nuclear Fission Reactors”. arXiv:nucl-ex/1011.3850v1 available at http://arxiv.org/abs/1011.3850 accessed 17 May 2011.
2 Eugene Guillian. 2008. “Far Field Monitoring of Rogue Nuclear Activity with an Array of Large antineutrino Detectors”. Earth Moon and Planets 99: 309-330. doi: 10.1007/s11038-006-9110-x
3 Fabio Mantovani, Luigi Carmignani, Gianni Fiorentini and Marcello Lissia. 2004. “Antineutrinos from Earth: A reference model and its uncertainties”, Physical Review D 69: 013001-013013. doi: 10.1103/PhysRevD.69.013001.
Yearly variations in the storage of CO2 by plants

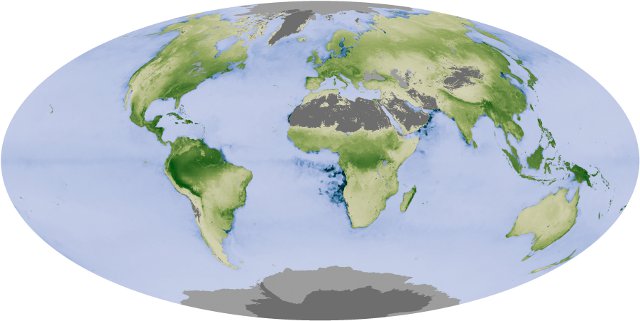
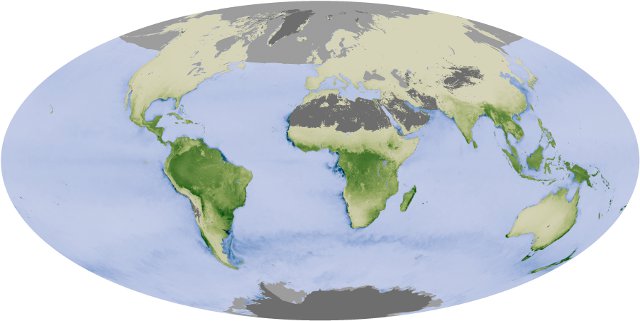
The maps below show the production of carbon dioxide by plants versus its absorption. The greenest areas are those that are storing the most carbon, where plant growth is greatest (grey areas indicate no plant life).

The map above shows the world in August, summer in the northern hemisphere. Note the particularly heavy absorption of carbon dioxide in the tropical rainforests of Bolivia, Peru, Brazil and other South American countries and the production of algae off the west coast of Africa.

The map below shows a much different picture, the world in December when it is winter in the northern hemisphere and summer in the southern hemisphere.

Storage of carbon dioxide by plants reaches its lowest point in December, causing the atmospheric concentration of carbon dioxide to peak.

It’s easy to see why plant production peaks when maps of incoming solar radiation for August and December are compared. The bright yellow areas are those receiving high amounts of incoming sunlight; the dark red areas receive the least.

August 2010

December 2010

Also interesting to compare are maps showing the balance of radiation. The orange areas in the maps below are those which are absorbing more radiation than they emit, and green areas are those which emit more radiation than they absorb.

The difference between areas near the equator that receive year-round sunlight and areas nearer the poles where sunlight is seasonal is quite marked; Greenland remains a net radiator throughout the year due to northerly position and its year-round white reflective coating of ice and snow.

August 2010

December 2010

24-hour star trails

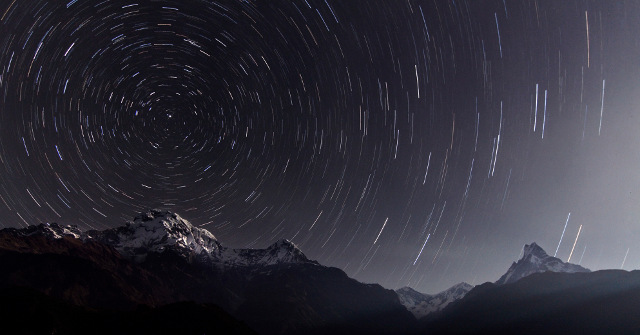
Star trails are created when the shutter of a camera is left open whilst pointed towards the sky; as the Earth rotates the stars etch out a path.

In a twenty-four hour period the Earth would complete one complete revolution and each star would create a complete circular path. Unfortunately when the Sun came up the image would be ruined, and so far nobody has captured fully circular star trails.

Professor Walter Lewin of MIT has issued a challenge through the Astronomy Picture of the Day website to create the first image of 24-hour star trails. In order to do so the photographer would have to travel into one of the polar circles where 24-hour periods during which the sun does not rise (“polar night”) are possible.

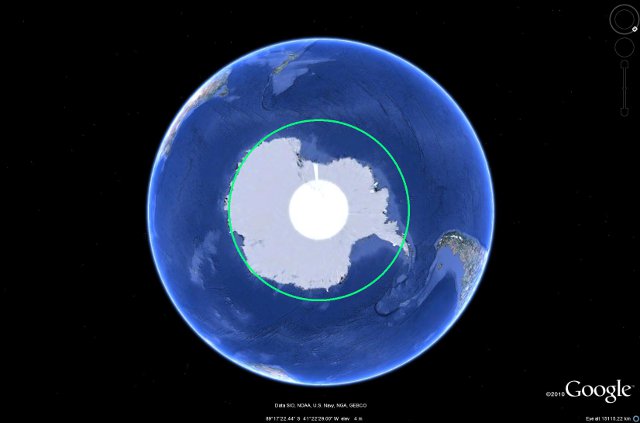
Heading south one would have to go below 66° 34′ S to enter the Antartic Circle and the only place to go is the Antarctic itself.

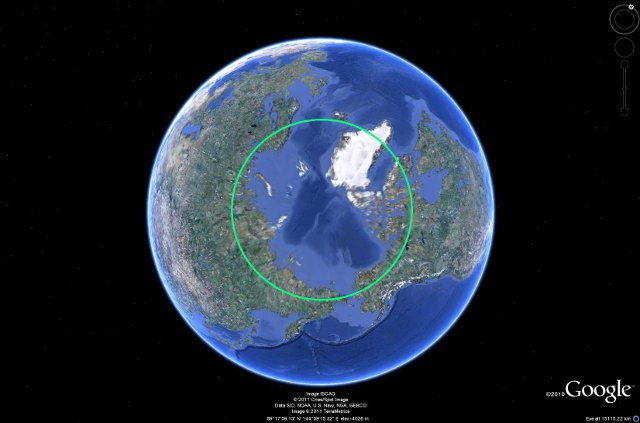
Heading North, into the Arctic Circle (above 66° 34′ N) your choices are much wider. Most of Greenland is in the Arctic Circle as are large parts of Russia, Canada and Alaska. In Europe you can choose between the north of Norway, Sweden and Finland.

It isn’t that simple however. Above and below 66° 34′ the Sun does not rise above the horizon but it gets pretty close and, when considering refraction of light by the atmosphere, the twilight would probably ruin your picture.

Beyond 84° 33′, eighteen degrees of latitude within the polar circles, true astronomical night persists, with the Sun never getting closer than eighteen degrees below the horizon. During this period the faintest stars that can be seen by the human eye would be visible all day. This cuts down on possible locations for a 24-hour star trail photoshoot.

In the northern hemisphere no civilisation exists beyond the town of Alert at 82° 30′ N and in the southern hemisphere only one research station is beyond the limit: the Amundsen-Scott South Pole Station at 90° 00′ S.

Hacking QR codes

QR codes are becoming quite popular, especially in advertising.

Photo by infovore

But QR codes have a security flaw – it’s not too difficult to turn one QR code into another with just a bit of OHP film and some Tippex.

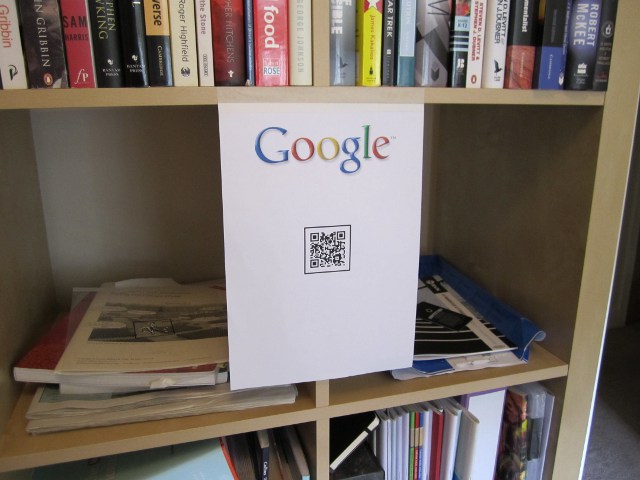
Obviously I don’t support vandalism so I’ll be using this fake Google poster that I made as an example.

You will need:

  • A mobile phone with a QR code scanning application. I used Barcode Scanner.
  • The free GIMP image manipulation software.
  • Clear overhead projector (OHP) film.
  • Tippex (or some way of printing in white).

Scan your target QR code and use the free QR code generator to generate a copy of the original code. You will also need to generate the QR code that you want to replace it with.


The target QR code is on the left and the replacement QR code is on the right.

Open both images in GIMP. Copy the replacement QR code into a new layer on top of the target QR code and change the layer mode to “Grain Extract”.

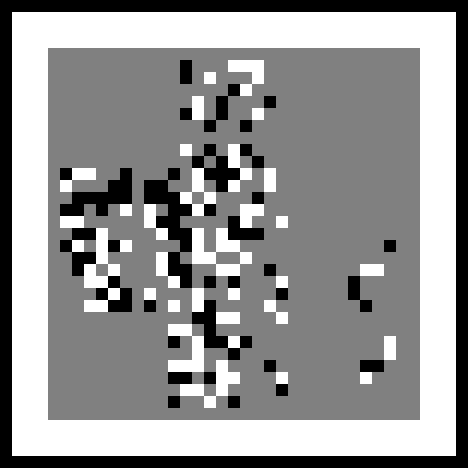
The grey areas are the areas where the two images overlap; there’s quite a lot of grey here because a lot of the information contained in the two codes is the same.* Black and white areas indicate differences between the two images; black pixels appear where the original is white and the replacement is black and vice versa.

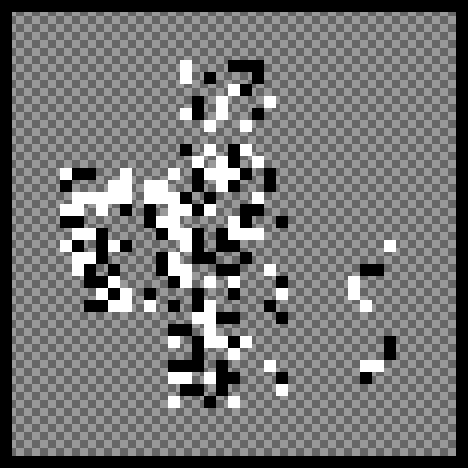
Select the grey areas and remove them from the image, and then invert the colour so that black pixels appear where the original is white and the replacement is black; and white pixels appear where the original is black and the replacement is white.

The chequered areas indicate that the image is transparent. It is important that all the images you save during this process are saved as PNGs which, unlike JPEGs, are lossless and support transparency.

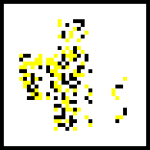
Now you need to print your overlay (at the same size as the original) onto transparent OHP film. The vast majority of printers are unable to print in white ink, but as it’s only the contrast between black and white that is important, you can replace the white with yellow for printing.

 
The overlay, ready for printing, is on the left, and the result of overlaying on the right.

If you’re using opaque yellow ink (most printers aren’t able to do this) then your overlay is ready. Otherwise you will need to replace the yellow pixels with white by using a correction fluid such as Tippex.

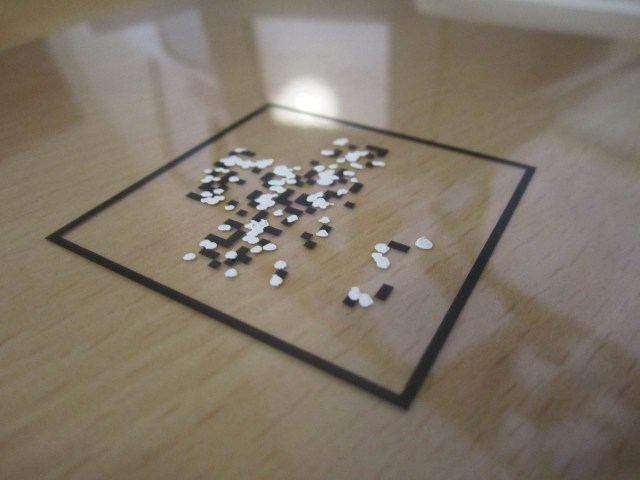
Now all you need to do is place your overlay on top of the original QR code to create your new replacement QR code. If you know what you’re doing you can download the GIMP .XCF file I created in the course of this post.

* Both codes have the same position and alignment indicators, the same version and timing information, and both contain the same “http://www.” data.

UK Energy Mix

A lot of people get confused between the electricity they use and the energy they use.

It’s easy to forget that the majority of people use natural gas for heating (e.g. a gas-fired central heating system) and cooking and petrol for transport; electricity only makes up a small part of the mix.

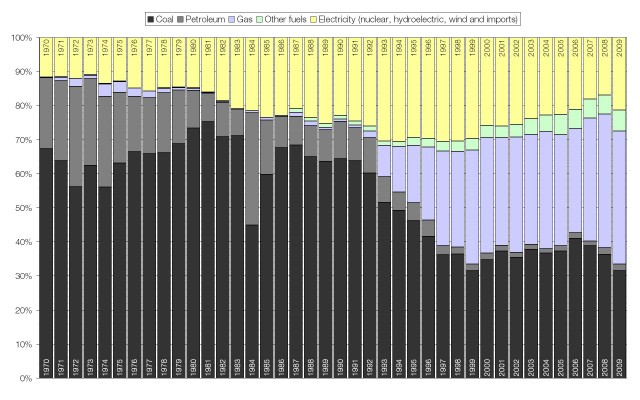
The graph below shows how the UK’s “energy mix” has changed over the last forty years.

Electrification peaked between 1994 and 1998, the same time that nuclear power was at it’s peak in the UK. Greater electrification would be a benefit to the environment as electricity is a low-carbon fuel, especially when nuclear and renewables make a large contribution to the fuel mix. Also the “Dash for Gas” in the ’90s is clearly visible as a very marked increase in the size of the blue section.