Fruit Gums can be used to demonstrate the concept of standard deviation.
Calculating standard deviation is easy, it’s simply:

Which, with the right teaching, and enough practice, anyone can learn to do. Understanding what standard deviation means is far more difficult.
I bought three boxes of Fruit Gums …
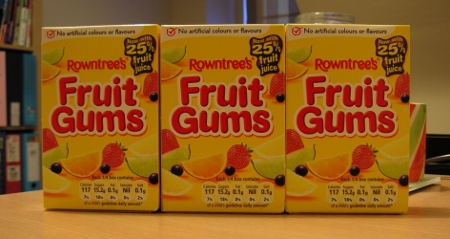
… and sorted them by flavour.
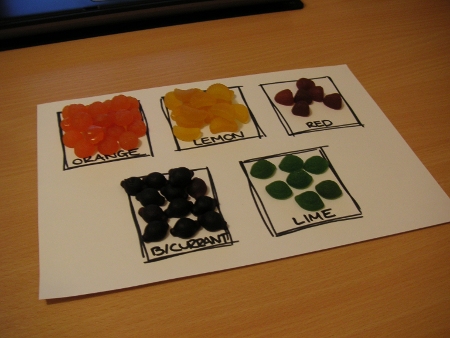
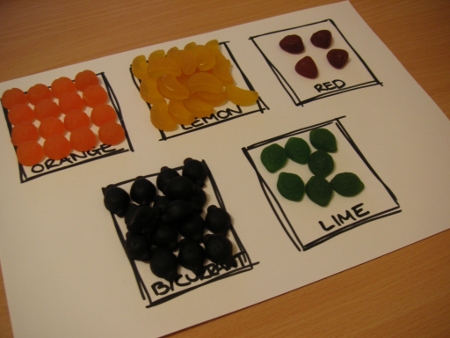
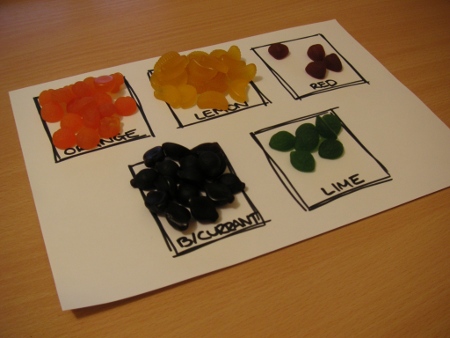
I collected the data in Excel which yielded the following spreadsheet:

The issue of standard deviation is summed up in the question: “What is the largest and smallest number of each flavour that you can expect to find in each box?”
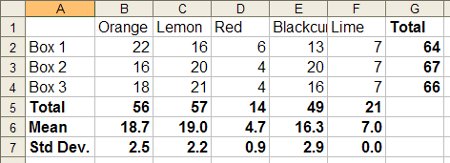
Lime is a special case. The were seven lime fruit gums in each box, meaning the standard deviation was zero. You could therefore – based on this sample alone – expect to find seven lime fruit gums in each box.
The standard deviation of a sample is a measurement of its spread, it tells you the mean distance from the mean.
For lemon fruit gums the mean is 19.0 plus or minus a standard deviation of 2.2. You could therefore expect to find – on average, based on this sample alone – between 16.8 and 21.2 lemon gums in each box. A box containing 25 lemon gums would be way outside the expected average contents.
The only outlier in this dataset is the first box’s orange gum count; based on the data collected we would expect a maximum of 21.2 orange gums. Clearly more fruit gums research is required.