Imagine that you’re trying to rank items that people have either voted for or against. What is the best way to do this?
You could simply take the number of for votes, and subtract the number of against votes. But this doesn’t work if there are a different number of votes for different items: an item with 100 for votes and 50 against votes would be ranked higher than an item with 30 for votes and 1 against vote. You could rank items by their ratio of for votes to against votes, essentially calculating the average score, but this doesn’t work either: an item with just a single for vote (ratio 1.000) would beat an item with 999 for votes and one against vote (ratio 0.999)
The correct method to use in this binomial case is to use the lower bound of Wilson’s score interval:

This is a fairly imposing equation, but what’s important is what it does, not how it works.
When ranking items using Wilson’s score interval we are still considering the for-against ratio, but we’re also taking into account the uncertainty created by having a different number of votes for each. For example, consider the following four items:
| Item | Total Votes | Votes For | Votes Against | Ratio |
| Item 1 | 10 | 5 | 5 | 0.5 |
| Item 2 | 20 | 10 | 10 | 0.5 |
| Item 3 | 50 | 25 | 25 | 0.5 |
| Item 4 | 100 | 50 | 50 | 0.5 |
As you can see, the ratio for each item is the same, but Item 4 received ten times the votes of Item 1 and should therefore be ranked higher.
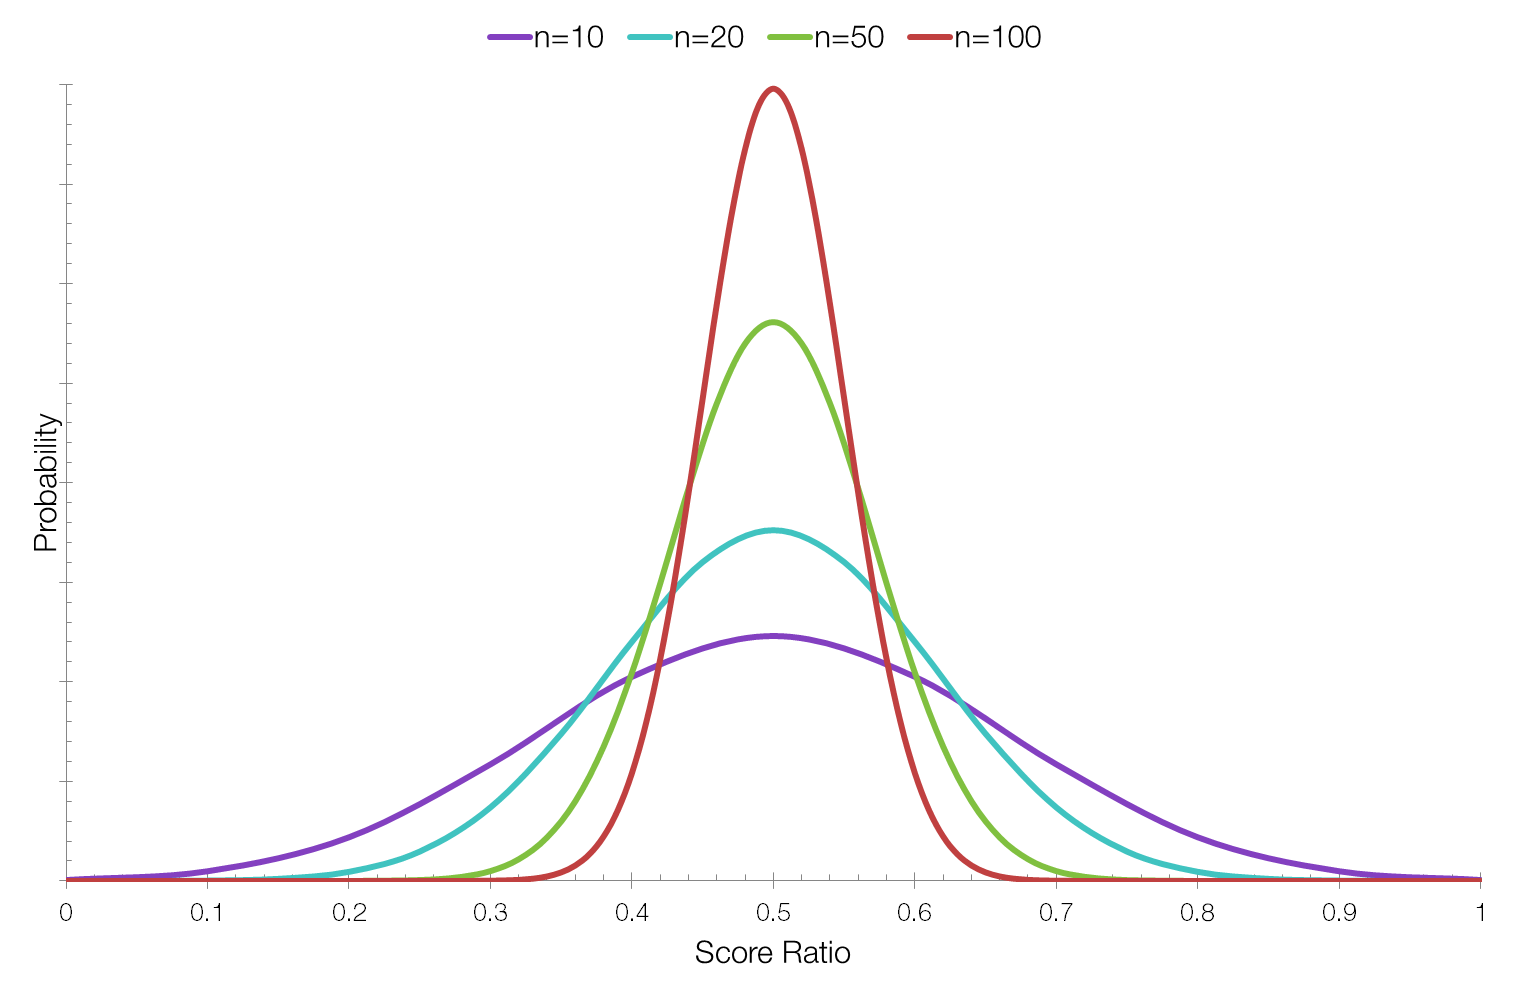
In the graph above, each item has the same score ratio, but the curve for Item 4 (n=100) is much sharper around 0.5 because there is less uncertainty about whether it has the “correct” score. An item with only 10 votes might have a “correct” ratio of 0.5, but it’s less likely than for an item with 100 votes.
If we now calculate the lower bound of Wilson’s score interval, we obtain the following results which we can then rank correctly:
| Item | Total Votes | For | Against | Ratio | Wilson SI |
| Item 1 | 10 | 5 | 5 | 0.5 | 0.2366 |
| Item 2 | 20 | 10 | 10 | 0.5 | 0.2993 |
| Item 3 | 50 | 25 | 25 | 0.5 | 0.3664 |
| Item 4 | 100 | 50 | 50 | 0.5 | 0.4038 |
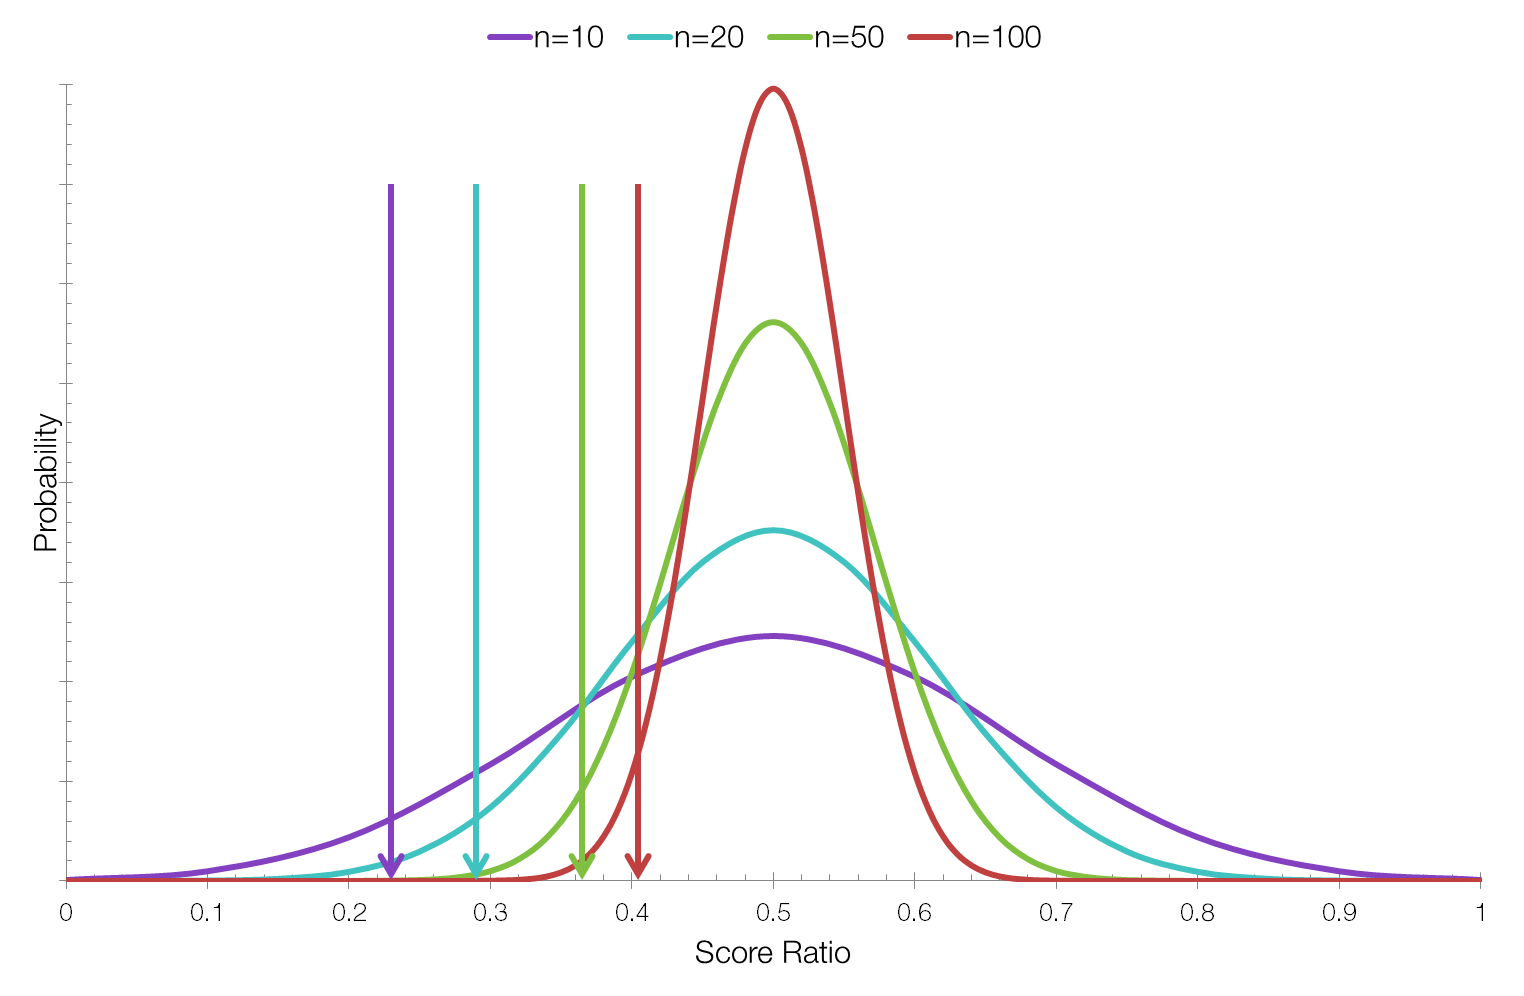
The position of each arrow indicates the lower bound of the Wilson score interval.
In this case we are taking the lower bound of a 95% confidence interval. Taking the lower bound at a confidence interval of 95% means that you are finding, given the data you have, the lowest “correct” score with a probability of 95%. We cannot be 100% sure, so 95% is a good choice – scientists like 95% confidence intervals.
This system could be extended to sites like Amazon that use star rating systems. Currently Amazon calculates a weighted average, which places a product with one ????? rating above a product with one hundred ????? ratings and one ????? rating. A better idea would be to convert the star ratings to for and against votes and use Wilson’s score interval, or a Bayesian model to rank products.